Qualitative Data Analysis
22 From Qualitative Data to Findings
Mikaila Mariel Lemonik Arthur
So far in this text, you have learned about various approaches to managing, preparing, reducing, and otherwise interacting with qualitative data. Because of the iterative and cyclical nature of the qualitative research process, it is not accurate to say that these steps come before analysis. Rather, they are an integral part of analysis. Yet there are procedures and methods for moving from the data to findings that are essential to completing a qualitative data analysis project. This chapter will outline three basic strategies for analysis of qualitative data: theoretical memos, data displays, and narratives; discuss how to move towards conclusions; and suggest approaches for testing these conclusions to ensure that they hold up to scrutiny.
But before the final stages of analysis occur, researchers do need to take a step back and ensure that data collection really is finished—or at least finished enough for the particular phase of analysis and publication the researcher is working on, in the case of a very long-term project. How do researchers know their data collection has run its course? Well, in some cases they know because they have exhausted their sample. If a project was designed to include interviews of forty respondents or the collection of 500 social media posts, then it is complete when those interviews have been conducted or those social media posts have been saved. In other cases, researchers know that data collection is complete when they reach saturation, or the point in the research process where continuing to engage in data collection no longer yields any new insights. This way of concluding data collection is more common in ethnographic work or work with archival documents.
In addition, since qualitative research often results in a truly enormous amount of data, one of the key tasks of analysis is finding ways to select the most central or important ideas for a given project. Keep in mind that doing so does not mean dismissing other ideas as unimportant. Rather, these other ideas may become the basis for another analysis drawing on the same data in the future. But one project, even an entire book, often cannot contend with the full body of data that a researcher or research team has collected. That is why it is important to engage in data reduction before or alongside the analysis process.
As researchers move from data towards findings, it is essential that they remember that, unlike much quantitative research, most qualitative research draws on small or otherwise unrepresentative samples, the findings also cannot be generalized. Thus, while the findings of qualitative research may be suggestive of general patterns, they must be regarded as just that: only suggestive.
Similarly, qualitative research cannot demonstrate causation. Demonstrating causation requires three elements:
- Association, or the ability to show a clear relationship between the phenomena, concepts, or processes in question,
- Temporal order, or the ability to show that the supposed cause came earlier in time than the supposed effect, and
- Elimination of alternatives, or the ability to show that there is no possible alternative explanation that could account for the phenomena in question.
While qualitative research can demonstrate association and temporal order, it cannot eliminate all alternative explanations—only well-designed and properly-controlled laboratory experiments can do so. Therefore, qualitative researchers (along with any quantitative researchers who are not relying on data from controlled laboratory experiments) need to take care to stay away from arguments suggesting that their analysis has proven anything or shown a causal relationship. However, qualitative researchers can locate evidence that supports the argument that a relationship is causal, leading to sentences like “This provides evidence suggestive of a causal relationship between X and Y.”
Theoretical Memos
Memo-writing has been discussed in prior chapters as a strategy for data reduction, but memos (or theoretical notes) can be a key element in the process of moving from data to findings. Memos and theoretical notes are texts the researcher writes for themselves in which they work through ideas from the data, connect examples and excerpts to themes and theories, pose new questions, and illuminate potential findings. Memos can serve as a way to move from the rich, contextual detail of qualitative data—detail that can sometimes be overwhelming—towards the broader issues and questions that motivate a study. Initial memos are often drafted while data collection is still going on. For instance, a researcher might write reflective memos that integrate preliminary thoughts and ideas about data, help clarify concepts central to the research project, or pull together disparate chunks of data. But additional, and more specifically analytical, memos come later in the process.
These memos may focus on a variety of topics and ideas, including reflecting on the researcher’s role and thought processes; contemplating the research question, potential answers, and shifts in the research focus; noting choices about coding strategies, the coding process, and choices made during coding; clarifying ethical or methodological issues that have arisen in the course of the research; considering what further research may need to be done in the future; and trying out ideas that may become part of the final analysis or write-up (Saldaña 2016). What is integral to the memo-writing approach is the recognition that writing is a key part of thinking (Roberts 1993). Thus, it is in drafting memos that researchers can come to better understand the ideas shaping their study and what their data is saying in response to their research question.
Saldaña (2016:274-76) suggests a variety of techniques for analytical processes that use theoretical memos as thinking tools:
- Select the ten most interesting passages—a paragraph to half a page in length—from your data. Arrange, rearrange, and comment on these passages.
- Choose the three “codes, categories, themes, and/or concepts” (Saldaña 2016:275) that most stand out to you. Write about how they relate to one another.
- Write a narrative in as few sentences as possible that incorporates all of the most important key words, codes, or themes from your study.
- Make sure your analysis is based in concepts instead of nouns. Saldaña advises the use of what he calls the “touch test”—if you can touch it, it is a noun rather than a concept. For instance, you can touch a formerly incarcerated person, but you cannot touch their reentry strategy for life after prison. Thus, if the data still seems to be focused on or organized around nouns, write about the concepts that these nouns might exemplify or illuminate.
Alternatively, you can deconstruct your research question into its central parts and write memos laying out what the data seems to be telling you about the answer(s) to each one of these parts. Then, you can go back to the data to see if your impressions are supported or if you are missing other key elements. But note that theoretical memos cannot be simply lists of anecdotes or ways to confirm pre-existing ideas. They must be explicitly and thoroughly grounded in the data.
Another option, related to the crafting of theoretical memos but distinct in its approach, is to create what Berg (2009) calls “short-answer sheets.” These function as a kind of open-ended survey, except instead of administering the survey directly to a respondent, researchers use an interview transcript or a text as a data source to complete the survey themselves. The short-answer sheet might summarize respondents’ answers to key portions of the research question or detail how texts address particular issues of concern to the project, for instance. Such an approach can help categorize different themes or types of responses by making it easier to see commonalities and patterns.
Data Displays
Another tool for moving from data to findings is called a data display. Data displays are diagrams, tables, and other items that enable researchers to visualize and organize data so that it is possible to clearly see the patterns, comparisons, processes, and themes that emerge. These patterns, comparisons, processes, and themes then enable the researcher to articulate conclusions and findings. Data displays can be used as analytical tools, as part of the presentation process (to be discussed elsewhere), or to serve both purposes simultaneously. While the discussion of data displays in this chapter will of necessity be introductory, researchers interested in learning more about the development and use of data displays in qualitative research can consult Miles and Huberman’s (1994) thorough and comprehensive sourcebook.
Researchers who use data displays need to remember that even as the displays enable the drawing of conclusions through looking for patterns and themes, this is not sufficient to support analysis and writeup. The display is simply a tool for analysis and understanding and cannot fully encapsulate the findings or the richness of the data. Thus, the analytical process always needs to return to the data itself, and whatever researchers write up or present needs to include stories, quotes, or excerpts of data to bring the concepts and ideas that are part of the study alive. The display is just that and does not itself contain or encapsulate the conclusions/analysis.
There are a variety of types of data displays, and this chapter will only present two common types: first, process and network diagrams, and second, matrixes, including tables, chronologies or timelines, and related formal methods. This summary should provide researchers with a sense of the possibilities. Of course, researchers can craft new approaches that make sense to them and for their specific projects—they should not feel bound to using only those types of data displays they have previously encountered. It is also worth noting here than many CAQDAS software packages integrate their own proprietary approaches to data display, and these can be very helpful for researchers using such software.
Process or Network Diagrams
Drawing various kinds of diagrams can help make sense of the ideas and connections in the data (Taylor, Bogdan, and DeVault 2016). Process and network diagrams are both key ways of visualizing relationships, thoughthe type of relationships they visualize differ. Process diagrams visualize relationships between steps in a process or procedure, while network diagrams visualize relationships between people or organizations. There is also a specialized kind of network diagram called a cognitive map that shows how ideas are related to one another (Miles and Huberman 1994). Process diagrams are particularly useful for policy-related applied research, as they can help researchers understand where an intervention would be helpful or where a current policy or program is falling short of its goals, as well as whether the number or complexity of steps in a process may be getting in the way of optimal outcomes.
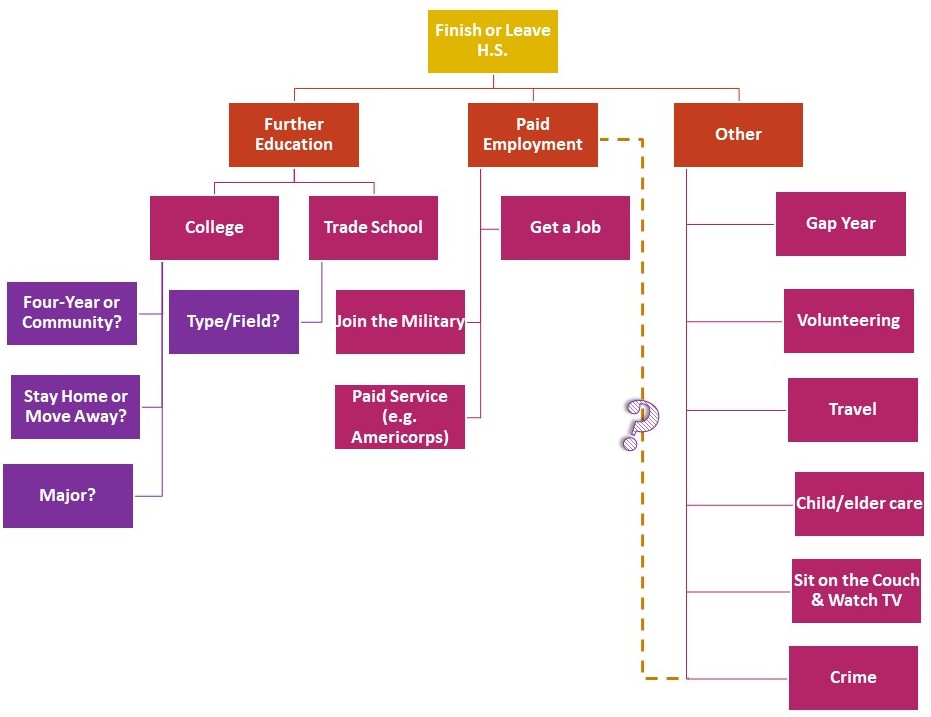
The category of visualizations that we call process diagrams also includes decision trees and flow charts. Decision trees are diagrams that specifically lay out the steps that people or organizations take to make decisions. For example, consider Figure 1, which is a hypothetical decision tree that could have emerged from a study of high school students considering their post-high school plans. Such a diagram can allow researchers to uncover unexpected sticking points or organize an analytical narrative around stages in the decision-making process. For example, maybe students are not aware of the option to participate in paid service programs or consider a gap year, options depicted in Figure 1. And, as the question mark suggests, those entering into criminal activity, such as drug sales, may see what they do as a kind of under-the-table employment—or as a rejection of employment. Similarly, flow charts can be used to diagram stages in a process and can depict complex, multidimensional relationships between these stages (flow charts can also be used to diagram personal relationships—one common use of flow charts is to diagram organizational relationships within corporations or other organizations, but more on this later).
To develop any type of process diagram, researchers should review their interview transcripts, fieldnotes, documents, and other data for instances were decisions are made (or avoided), events occurred that could have had a different outcome, or steps are taken or not taken that lead or could have led in a particular direction. All of these occurrences should then be listed and categorized, and researchers should work out which decisions or steps seem to depend on earlier decisions or steps, to be associated with other co-occurring decisions or steps, or to shape later decisions or steps. It is essential to ensure that no decisions or steps are missed when the diagram is created. For example, if one were to create a diagram of the process of making a peanut butter and jelly sandwich, it would not be sufficient to say “put peanut butter and jelly on bread.” Rather, the diagram would have to account for choosing and obtaining the peanut butter, jelly, and bread; the utensils needed spread the peanut butter and jelly; how to go about spreading it; and the fact that the sandwich needs to be closed up after the spreading is complete.

Network diagrams, as noted above, visualize the connections between people, organizations, or ideas. There is an entire subfield of sociology concerned with network analysis, and it has developed a specialized language for talking about these diagrams. In this specialized language, the individual people, organizations, or ideas included in the diagram are called nodes (represented by the blue circles in Figure 2), while the lines connecting them are called edges (represented by the black lines in Figure 2). Analysts can choose to use double-headed arrows, which indicate reciprocal relationships, or single-headed arrows, which indicate one-way relationships—or lines without arrows, if the direction of relationships is unclear, as in Figure 2. While the field of network analysis typically relies on quantitative and computational methods to draw conclusions from these diagrams, which can be large and complex enough that generating them requires specialized software, network diagrams can also be useful tools for smaller-scale qualitative research because of the way they enable visualization of complicated webs of relationships.
To develop a network diagram, researchers must begin by combing through their data to find all of the individual nodes (people, organizations, ideas, or other entities) that will be included in the diagram. Then, they must find the relationships between the nodes, which can require a lot of time spent reviewing codes and categories produced as part of data reduction as well as many memoing tasks designed to help clarify these relationships and understand where each node fits in the broader scheme of things. Analysts can then draw diagrams by hand, by using computer graphics software, or by using specialized network analysis software. Alternatively, researchers may wish to create a flow chart. As noted above, flow charts can be extremely useful for diagramming relationships—the difference is that in a flow chart the relationships tend to be more formalized, like supervisory relationships in a corporation or volunteer organization (this is often referred to as an organizational chart) or kinship ties in a family tree. Once researchers create an initial draft of their network diagram, they need to look back at the evidence and data they have collected, especially searching for disconfirming bits of data that might suggest alternative network arrangements, in order to be sure they are on the right track.
Once network diagrams are created, they can be used in a variety of ways to help researchers build towards conclusions and findings. As noted above, they can be especially useful for understanding processes or policies, as they enable analysts and viewers to see whether something is working, where the social breakdowns might be, or where a procedure might benefit from changes. Of course, network diagrams also help make relationships and patterns of interaction clear, and by following the path laid out in the diagrams, it is possible to uncover insight into what the extended network surrounding an individual might look like—a network the individual themselves may not even be fully conscious of. Examining the shape and structure of the network can also answer a variety of questions. For example: are lots of entities clustered closely together in one area? Are there parts of the diagram where it seems like there are very few connections, or where it takes a lot of steps to get from one person to another? Are there cliques, or portions of the network where everyone is close with everyone else in their subgroup, or are ties spread more evenly? Are there ties that seem like they should exist but do not? And how does the diagram map on to social processes in the real world, such as the spread of ideas, behaviors, or disease? The possibilities go on. The point, though, is that these approaches allow researchers to see the way relationships interact and intersect as part of building their analysis.
Matrices and Tables
Another type of data display arranges data in a grid. We call these displays matrices (the plural of matrix) or tables. Such displays let researchers more clearly see patterns of similarities and differences and observe comparisons across cases or types of cases. In developing a matrix-based data display, researchers have a variety of choices to make. The most important concern is that the matrix be usable for analysis and display purposes. Thus, researchers should strive to create matrixes that they can see all at once—those fitting on a single sheet of paper or a single computer screen. As a simple heuristic or rule designed to help guide matrix development, try to ensure that a matrix has no more than 10-12 rows or columns, and a number closer to six may be preferable. If a matrix cannot be adjusted to usably fit into one view, researchers should consider whether it is possible to break the matrix into component parts, each of which fits onto a screen. For example, a study of racism in the residential real estate industry might, rather than including one overall matrix, include separate matrixes detailing the experiences of real estate agents, home buyers, and home sellers, or alternatively separate matrixes for rental markets and sales markets. While many researchers draw matrixes by hand, word processing programs have excellent table construction features that enable the development of clear, organized, and well-formatted matrixes.
In order to populate the matrix, it is necessary for researchers to already have completed some level of data reduction and preliminary analysis, such as coding and/or the development of typologies or categories. These steps will then form the basis of matrix development. However, there are many different ways to organize the data in a matrix, and thus there are a variety of questions researchers must think through as they develop this type of data display.
First, will the matrix be used to explore one case at a time, with the grid being used to illuminate elements of the case and with a new copy of the matrix being completed for each case covered in the data? Or alternatively, will it be used to make cross-case comparisons or look for patterns?
Second, will this matrix be descriptive or explanatory? A descriptive matrix is especially helpful in circumstances where researchers are trying to categorize or classify data or develop a typology with key characteristics for each type or category. In contrast, a matrix designed to facilitate explanation needs to go well beyond the detailed characteristics of each case to instead think about comparisons, processes, potentially-causal mechanisms, and other dynamics, enabling researchers to see relationships among the data.
Third, which axes of variation—variables, if you will—will be incorporated into the table? Remember, a typical matrix has two dimensions, the columns and the rows, though modern computer applications can create matrixes that are multidimensional and thus include one or more additional axes. These axes might include individual respondents, types or categories of people, settings or contexts, actions people take, events that have occurred, distinct perspectives, organizations, processes and procedures, or portions of the research question, just to name a few.
Fourth, does the order of the data in the table show anything important about the data? In many cases it does not, and the order of table columns or rows is, for all intents and purposes, random. But this need not be the case—order can be a valuable part of both the development of the data display and the analytical power it presents. Order can be used to convey information about participants’ social roles, timing and process, or the magnitude or strength of ideas and emotions, just to give a few examples.
Fifth, what information will be placed within each cell of the matrix or table? Will the table cells include summaries of data, events, or stories? Vignettes developed from multiple accounts? Cross-references to specific interview transcripts or documents? Key quotes? Explanations of what the data shows about the intersection of the ideas noted in the columns and rows? Images? Or perhaps there is another idea that is a better fit for a particular research project.
Once the design and structure of the matrix have been developed, researchers then return to their data to complete the matrix, filling in headers for the rows and columns and then entering information of the specified kind into each table cell. To do so properly, researchers need to be sure they are returning to the raw data frequently to check that details are correct and that nothing has been inappropriately excluded.
After the matrix has been fully completed, it can be used to facilitate analysis. The design of a matrix makes it particularly useful for observing patterns or making comparisons, but matrixes can also be helpful in making themes or categories clear or looking for clusters of related ideas or cases. For example, consider the matrix shown in Table 1. Note that this matrix was constructed based on an already-published article (Edin 2000), but it reflects the kind of approach a researcher might take as part of the creation of data displays for analysis. The study on which Table 1 was based was an inductive in-depth interview study of low-income single mothers who identified as Black or White in three United State cities, looking at how low-income women think about marriage. While the author, Kathryn Edin, does not detail her analysis strategy in the article, she likely used a coding-based approach to uncover five key factors shaping women’s thoughts about marriage: affordability, respectability, control, trust, and domestic violence. By selecting a series of quotes that illustrate each theme and categorizing them by the race of the respondent, it is possible to see whether there are important racial differences in any of the themes. In fact—as may be clear from Table 1 itself—there are not major racial differences in the way Black and White respondents discussed each theme, except that White respondents were more likely to think “marrying up” was a realistic possibility; there were, however, differences in the frequency with which respondents discussed each theme, which Edin discusses in the text of the article. As this might suggest, some researchers, including Edin, use counting as part of the matrix process, whether to count rows and column with specific characteristics or to insert numbers into table cells to quantify the frequency of particular types of responses, but care should be taken with numbers to avoid risks related to over-quantification (as discussed elsewhere in this text).
Table 1. Themes and Quotes from Edin 2000
|
Black |
White |
|
| Affordability | “Men simply don’t earn enough to support a family. This leads to couples breaking up.” | “I couldn’t get him to stay working….It’s hard to love somebody if you lose respect….” |
| “You can’t get married and go on living with your mother. That’s just like playing house.” | ||
| “We were [thinking about marriage] for a while, but he was real irresponsible. I didn’t want to be mean or anything, [but when he didn’t work] I didn’t let him eat my food.” | ||
| Respectability | “I am not going to get married and pay rent to someone else. When we save up enough money to [buy] an acre of land and [can finance] a trailer, then we’ll marry.” | I plan to “marry out of poverty” and become a housewife. |
| I want to marry “up or not at all.” | ||
| Control | “[I won’t marry because] the men take over the money. I’m too afraid to lose control of my money again. | “If we were to marry, I don’t think it would be so ideal. [Husbands] want to be in charge, and I can’t deal with that.” |
| “I’m the head of the household right now, and I make the [financial] decisions. I [don’t want to give that up].” | “[Marriage isn’t an option] right now. I don’t want any man thinking that he has any claim on my kids or on how I raise them.” | |
| “One thing my mom did teach me is that you must work some and bring some money into the household so you can have a say in what happens. If you completely live off a man, you are help-less. That is why I don’t want to get married until I get my own [career] and get off of welfare.” | “I don’t want to depend on nobody. It’s too scary.” | |
| “You know, I feel better [being alone] because I am the provider, I’m getting the things that I want and I’m getting them for myself, little by little.” | ||
| Trust | “All those reliable guys, they are gone, they are gone. They’re either thinking about one of three things: another woman, another man, or dope….” | “I was married for three years before I threw him out after discovering that he had another woman. I loved my husband, but I don’t [want another one]. This is a wicked world we are living in.” |
| “I would like to find a nice man to marry, but I know that men cannot be trusted.” | “I want to meet a man who will love me and my son and want us to grow together. I just don’t know if he exists.” | |
| “I’m frustrated with men, period. They bring drugs and guns into the house, you take care of their kids, feed them, and then they steal your rent money out of your purse.” | “Love is blind. You fall in love with the wrong one sometimes. It’s easy to do.” | |
| Domestic Violence | “My daughter’s father, we used to fight. I got to where nobody be punching on me because love is not that serious. And I figure somebody is beating on you and the only thing they love is watching you go the emergency room. That’s what they love.” | “…after being abused, physically abused, by him the whole time we were married, I was ready to [kill him]. He put me in the hospital three times. I was carrying our child four and a half months, he beat me and I miscarried. |
| “So [we got in the car] and we started arguing about why he had to hang around people like that [who do] drugs and all that sort of stuff. One thing led to another and he kind of tossed me right out of the car.” | “I was terrified to leave because I knew it would mean going on welfare…. But that is okay. I can handle that. The thing I couldn’t deal with is being beat up.” |
A specialized type of matrix that works somewhat differently is the timeline or chronology. In this type of matrix, one axis is time (whether times of day, days of the week, dates, years, ages, or some other time scale), and the researcher fills in details about events, interactions, or other phenomena that occurred or that could be expected to occur at each given time. Researchers can create separate timelines for individual respondents or organizations, or can use common timelines to group and summarize data.
Matrixes also form the basis of a set of more complex analytical methods, including truth tables and related formal methods, such as Charles Ragin’s Qualitative-Comparative Analysis (QCA). While a full exploration of such approaches is beyond the scope of this text, new data analysts should be aware of the existence of these techniques. They are designed to formalize qualitative analysis (Luker 2008) using a rigorous procedure focusing on the existence of necessary and sufficient factors. Ragin (2000; 2008) uses Boolean algebra and the logic of sets to determine which factors or groups of factors are necessary and which factors or groups of factors are sufficient for each important outcome. Boolean algebra is the mathematical expression of logical relationships based in the principles of syllogism—deductive reasoning based on a series of premises (Boole 1848). Sets simply represent groups of similar objects that are classified together. Thus, in QCA and other techniques based on this approach, factors and combinations of factors are evaluated to see which are necessary—without them, the outcome cannot happen—and which are sufficient—with them, the outcome must always happen.
There are a variety of other types of formal methods as well. For example, in case study research, researchers might use quasi-experimental approaches to compare cases across key axes of variation (Gerring 2007). Another approach is called process tracing, in which data, “with the aid of a visual diagram or formal model” is used to “verify each stage of this model” (Gerring 2007:184), and there are many others not discussed here. Researchers who seek formal approaches for developing within-case or cross-case comparisons can turn to the robust literature on case study research as they enhance their methodological toolkits.
Narrative Approaches
In many cases, researchers rely on the crafting of narratives as a key part of the analytical process. Such narratives may be used only for analysis or they may be integrated into the ultimate write-up of the project. There are a variety of different narrative approaches (Grbich 2007). One approach is the case study, in which the researcher tells the story of a specific individual or organization as part of an extended narrative discussion or a short summary. A given project may include multiple case studies. Case studies can be used to holistically highlight the dynamics and contexts under exploration in a project, seeking to describe and/or explain the dynamics of the case or cases under examination. Another approach is to use vignettes, or “small illustrative stor[ies]” (Grbich 2007:214) created by summarizing data or consolidating data from different sources. Vignettes can be used to bring attention to particular themes, patterns, or types of experiences. Similarly, anecdotes are short tales that are used to illustrate particularly central ideas within the discussion. Narratives can be descriptive—simply using the data to tell a story—or theoretical and analytical, where data is used to illustrate concepts and ideas (Taylor, Bogdan, and DeVault 2016).
Narrative approaches are used most frequently for ethnographic and archival data. Here, the common strategy is to craft what is called a thick description, a detailed account that is rich with details about the observations, actors, and contexts, with analytical points highlighted in the course of the narrative (Berg 2009). Researchers using such a strategy often also employ metaphor to help them make sense of the ideas that they are working with. Berg (2009:236), for example, uses “revolving-door justice,” a phrase used to refer to a situation in which people rapidly move into and out of the criminal justice system, as an example of a metaphor which is analytically useful.
Grounded theory is a particular approach to both data collection and analysis in which researchers collect data, identify themes in the data, review and compare the data to see if it fits the themes and theoretical concepts, collect additional data to continue to refine the analytical ideas, and ultimately build theory that reflects what the data has to say about the world (Taylor, Bogdan, and DeVault 2016). When utilizing a grounded theory approach, researchers must take care to ensure that theories they build are in fact grounded in data, rather than in prior knowledge or scholarship (Bergin 2018). Thus, grounded theory is a highly inductive approach to research and data analysis. A grounded theory approach to data analysis involves open coding, the writing of theoretical memos, further selective coding to validate categories and ideas, and integration of the empirical data with the theoretical memos (Grbich 2007).
Narrative approaches can also center the use of quotes from participants. Grbich (2007) discusses several ways to do this:
- Layering, or the interweaving of different perspectives to show how views and experiences may diverge;
- Pastiche, in which many voices are brought together to create an overall picture of experiences; and
- Juxtaposition, in which opposing views are contrasted to one another.
Most common is an approach in which a series of quotes exemplifying a particular theme or idea are presented together. Each quote must be analytically explained in the body of the text—they cannot simply stand on their own. For example, Figure 3 below presents an excerpt from the section of Kathryn Edin’s paper on motherhood and marriage among poor women that focuses on control. In it, you can see how a theme is discussed and a series of quotes showcasing respondents’ words relating to this theme are presented, with the meaning and relevance of each quote explained before or after the quote.
Whether to choose memo-writing, data display, or narrative approaches to analysis, or some combination of two or more of these approaches, is determined both by researchers’ personal styles of research and analysis and by the nature, type, and complexity of the data. For instance, a multifaceted case study of an organization with multiple departments may have a story which is too complex for a narrative approach and thus requires the researcher to find other ways of simplifying and organizing the data. An ethnography of a girls’ soccer team over the course of a single season, though, might lend itself well to a narrative approach utilizing thick description. And interviews with people recovering from surgery about their experiences might best be captured through a narrative approach focusing on quotes from participants.
![A screenshot of text that reads: "In a non-marital relationship, women often felt they had more control than they would have had if they married. Even if the couple cohabited, they nearly always lived with her mother or in an apartment with her name on the lease. Thus, mothers had the power to evict fathers if they interfered with child rearing, or tried to take control over financial decision-making. Mothers said that fathers who knew they were "on trial” could do little about this state of affairs, especially since they needed a place to live and could not generally afford one on their own. One African American Philadelphia-area respondent's partner quipped, "her attitude is like, ‘it's either my way or the highway.’" Why was control, not power, such an important issue for these women? Most mothers said they thought their children's fathers had very traditional notions of sex roles-notions that clashed with their more egalitarian views. One white cohabiting mother from Charleston said, "If we were to marry, I don't think it would be so ideal. [Husbands] want to be in charge, and I can't deal with that.” Regardless of whether or not the prospective wife worked, mothers feared that prospective husbands would expect to be “head of the house,” and make the “final” decisions about child rearing, finances, and other matters. Women, on the other hand, felt that since they had held the primary responsibility for both raising and supporting their children, they should have an equal say. When we asked single mothers what they liked best about being a single parent, their most frequent response was “I am in charge,” or “I am in control.” Mothers seemed willing to take on the responsibilities of child rearing if they were also able to make and enforce the rules. In most mothers' views, the presence of fathers often interfered with their parental control, particularly if the couple married. Most women also felt that the presence of a husband might impede their efforts to discipline and spend time with their children. Mothers criticized men for being “too demanding” of their time and attention. A white Chicago mother [the text ends mid-sentence]."](https://pressbooks.ric.edu/app/uploads/sites/2/2022/09/edin-2000-exerpt.png) Figure 3. An Example of the Use of Quotes in a Narrative Approach (Edin 2000:121)
Figure 3. An Example of the Use of Quotes in a Narrative Approach (Edin 2000:121)
Making Conclusions
Theoretical memos, data displays, and narratives are not themselves conclusions or findings. Rather, they are tools and strategies that help researchers move from data towards findings. So how do researchers use these tools and strategies in service of their ultimate goal of making conclusions? Most centrally, this occurs by looking for patterns, comparisons, associations, or categories. And patterns are probably the most common and useful of these. There are a variety of types of patterns that researchers might encounter or look for. These include finding patterns of similarities, patterns of predictable differences, patterns of sequence or order, patterns of relationship or association, and patterns that appear to be causal (Saldaña 2016).
Making comparisons across cases is one way to look for patterns, and doing so also enhances researchers’ ability to make claims about the representativeness of their data. There are a variety of ways to make comparisons. Researchers can make predictions about what would happen in different sets of circumstances represented in the data and then examine cases to see whether they do or do not it with these predictions. They can look at individual variables or codes across cases to see how cases are similar or different. Or they can focus on categorizing whole cases into typologies. Categorization is an especially important part of research that has used coding. Depending on the approach taken, researchers tend to collapse groups of codes into categories either during the development of the coding strategy, as part of the coding process, or once it concludes, and it is these broader categories that then provide the core of the analysis (Saldaña 2016). To take some examples of approaches to analysis that might involve comparison, a researcher conducting ethnographic research in two different prisoner-reentry programs with different success rates might compare a series of variables across the two programs to see where the key differences arise. Or a project involving interviews of marketing professionals might categorize them according to their approach to the job to see which approaches have most helped people move forward in their careers.
Another strategy for developing conclusions, one that must be more tightly integrated into the data collection process, involves making predictions and then testing whether they come true by checking back with the site or the participant and seeing what happens later (Miles and Huberman 1994). For instance, consider an interview-based study looking at adult women returning to college and asking how they are adjusting. The researcher might learn about different strategies student respondents use and then might develop a hypothesis or prediction about which of these strategies will be most likely to lead to students staying enrolled in college past their first year. Then, the researcher can follow up with participants a year later to see if the strategies worked as predicted.
A final approach to developing conclusions involves the use of negative or deviant case methodologies. Deviant case methodologies are usually positioned as a sampling strategy in which researchers sample cases that seem especially likely to present problems for existing theory, often selecting on the dependent variable. However, deviant case methodologies can also be used long after sampling is completed. To do this, researchers sift through their data, looking for cases that do not conform to their theory, that do not fit the broader patterns they have observed from the body of their data, or that are as different as possible from other cases, and then they seek to understand what has shaped these differences. For instance, a project looking at why countries experience revolutions might collect data on a variety of countries to see if common theories hold up, zoning in on those cases that do not seem to it the theories. Or a project involving life-history interviews with men in prison for murder might devote special attention to those men whose stories seem least like the others.
While qualitative research does not have access to heuristics as simple as the null hypothesis significance testing approach used by quantitative researchers, qualitative researchers can still benefit from the use of an approach informed by the idea of the null hypothesis (Berg 2009). In simple terms, the null hypothesis is the hypothesis that there is no relationship or association between the variables or concepts under study. Thus, qualitative researchers can approach their data with the assumption of a null hypothesis in mind, rather than starting from an assumption that whatever they are hoping to find will be displayed in their data. Such an approach reduces the likelihood that data becomes a self-fulfilling prophecy. Deviant case methodology—looking for examples within the data that do not fit the explanations researchers have developed and considering how the analysis can account for these aberrations (Warren and Karner 2015)—has a particular strength in this regard.
Testing Findings
Settling in on a set of findings does not mean a research project has been completed. Rather, researchers need to go through a process of testing, cross-checking, and verifying their conclusions to be sure they stand up to scrutiny. Researchers use a variety of approaches to accomplish this task, usually in combination.
One of the most important is consulting with others. Researchers discuss their findings with other researchers and other professional colleagues as well as with participants or other people similar to the participants (Warren and Karner 2015). These conversations give researchers the opportunity to test their logic, learn about questions others may have in regards to the research, refine their explanations, and be sure they have not missed obvious limitations or errors in their analysis. Presenting preliminary versions of the project to classmates, at conferences or workshops, or to colleagues can be particularly helpful, as can sharing preliminary drafts of the research write-up. Talking to participants or people like the participants can be especially important. While it is always possible that a research project will develop findings that are valid but that do not square with the lived experiences of participants, researchers should take care in such circumstances to responsibly address objections in ways that uphold the validity of both the research and the participants’ experiences and to listen carefully to criticisms to be sure all potential errors or omissions in the analysis have been addressed. Feminist, critical social science, and action research perspectives especially value participants’ expertise and encourage researchers to give participants final control over how they are portrayed in publication and presentation. For instance, feminist researchers often seek to ensure that relationships between researchers and participants are non-exploitative and empowering for participants (Grbich 2007), which may require that researchers do not position themselves as experts about participants’ lives but rather provide participants with the opportunity to have their own lived experience shine through.
However, it is essential to be attentive to how participants’ feedback is used. Such feedback can be extremely important to a project, but it can also misdirect analysis and inclusions in problematic ways. Participants vary greatly in their degree of comprehension of social scientific methods and language. This means researchers must strive to present their results to participants in ways that make sense to them. Participants’ critiques of methods and language—while potentially illuminating—also could, if incorporated into the project, weaken its scientific strengths. In addition, there can be disagreements between different participants or groups of participants, as well as between participants and researchers, about explanations for the phenomena under consideration in the study.
While many qualitative researchers emphasize the important of participants’ own knowledge about their social worlds, sometimes individuals are not the best at analyzing and understanding their own social circumstances. For example, consider someone you know whose romantic relationship is ending and ask them what happened. There is a good chance that the explanations offered by each partner are different, and maybe even that neither explanation matches what you as an outside observer see. Similarly, participants’ narratives and explanations are a vital part of conclusion-building in qualitative research, but they are not the only possible conclusions a project can draw. In addition, attention to participants’ views can sometimes lead researchers to self-censor, especially when researchers have ongoing relationships with participants or contexts and when participants’ priorities and understandings are opposed to researchers’. Similarly, participants may use various discursive strategies—or ways of using language intended to have particular effects—that researchers may wish to critically interrogate. For example, what researchers call “race talk,” or the discourse strategies people use to talk about and around race (Twine and Warren 2000; Van Den Berg, Wetherell, and Houtkoop-Steenstra 2003), can shed light on patterns of thought that participants may not be willing to openly admit.
Returning to participants to discuss findings and conclusions can also lead to new ethical, privacy, and even legal concerns as participants may be exposed to information gathered from others. While an interview-based study using appropriate care for confidentiality and in which participants do not know one another is not likely to raise these concerns, as long as data has been handled appropriately, in the case of ethnographic research or interviewing in which participants are acquainted, even careful attention to confidentiality may still leave the possibility that participants recognize one another in the narrative and analysis. Thus, it may be necessary to share only those sections of the data and analysis talking about a participant with that participant.
But researchers need not rely only on others to help them assess their work. There are a variety of steps researchers can take as part of the research process to test and evaluate their findings. For instance, researchers can critically re-examine their data, being sure their findings are firmly based on stronger data: data that was collected later in the research process after early weaknesses in collection methods were corrected, first-hand observations rather than occurrences the researcher only heard about later, and data what was collected in conditions with higher trust. They should also attend to the issue of face validity, the type of validity concerned with whether the measures used in a study are a good fit for the concepts. Sometimes, in the course of analysis, face validity falls away as researchers focus on exciting and new ideas, so returning to the core concepts of a study and ensuring the ultimate conclusions are based on measures that fit those concepts can help ensure solid conclusions.
Even if a study does not specifically use a deviant case methodology (as discussed above), researchers can take care to look for evidence that is surprising or that does not fit the model, theory, or predictions. If no such evidence appears—if it seems like all of the data conforms to the same general perspective—remember that the absence of such evidence does not mean the researcher’s assumptions are correct. For example, imagine a research project designed to study factors that help students learn more math in introductory math classes. The researcher might interview students about their classes and find that the students who report that there were more visual aids used in their class all say that they learned a lot, while the students who report that their classes were conducted without visual aids say they did not learn so much. In this analysis, there may not have been any responses that did not fit this overall pattern. Clearly, then, something is going on within this population of students. But it is not necessarily the case that the use of visual aids impacts learning. Rather, the difference could be due to some other factor. Students might have inaccurate perception of how much they have learned and the use or lack of use of visual aids could impact these perceptions. Or visual aids might have a spurious relationship with students’ perceptions of learning given some other variable, like the helpfulness of the instructor, that correlates with both perception and use of visual aids. Remember that a spurious relationship is a relationship in which two phenomena seem to vary in association with one another, but the observed association is not due to any causal connection between the two phenomena. Rather, the association is due to some other factor that is related to both phenomena but that has not been included in the analysis.
Careful attention to logic can also help researchers avoid making conclusions that turn out to be spurious. If an association is observed, then the researcher should consider whether that association is plausible or whether there might be alternative explanations that make more sense, turning back to the data as necessary. Indeed, researchers should always consider the possibility of alternative explanations, and it can be very helpful to ask others to suggest alternative explanations that have not yet been considered in the analysis. Not only does doing this increase the odds that a project’s conclusions will be reliable and valid, it also staves off potential criticism from others who may otherwise remain convinced that their explanations are more correct.
Researchers should always make clear to others how they carried out their research. Providing sufficient detail about the research design and analytical strategy makes it possible for other researchers to replicate the study, or carry out a repeat of the research designed to be as similar as possible to the initial project. Complete, accurate replications are possible for some qualitative projects, such as an analysis of historical newspaper articles or of children’s videos, and thus providing the level of detail and clarity necessary for replication is a strength for such projects. It is far less possible for in-depth interviewing or ethnography to be replicated given the importance of specific contextual factors as well as the impact of interviewer effect. However, providing as much detail about methodological choices and strategies as possible, along with why these choices and strategies were the right ones for a given project, keeps the researcher and the project more honest and makes the approach more clear, as the goals of good research should include transparency.
Additionally, research projects involving multiple coders should have already undergone inter-rater reliability checks including at least 10% of the texts or visuals to be coded, and, if possible, even projects with only one coder should have conducted some inter-rater reliability testing. A discussion of the results of inter-rater reliability testing should be included in any publication or presentation drawing on the analysis, and if inter-rater reliability was not conducted for some reason this should be explicitly discussed as a limitation of the project. There are other types of limitations researchers must also clearly acknowledge, such as a lack of representativeness among respondents, small sample size, any issues that might suggest stronger-than-usual interviewer or Hawthorne effects, and other issues that might shape the reliability and validity of the findings.
There are a variety of other cautions and concerns that researchers should keep in mind as they build and evaluate their conclusions and findings. The term anecdotalism refers to the practice of treating anecdotes, or individual stories or events, as if they themselves are sufficient data upon which to base conclusions. In other words, researchers who are engaging in anecdotalism present snippets of data to illustrate or demonstrate a phenomenon without any evidence that these particular snippets are representative. While it is natural for researchers to include their favorite anecdotes in the presentation of their results, this needs to be done with attention to whether the anecdote illustrates a broader theme expressed throughout the data or whether it is an outlier. Without this attention, the use of anecdotes can quickly mislead researchers to misplace their focus and build unsupported conclusions. One of the most problematic aspects of anecdotalism is that it can enable researchers to focus on particular data because it supports the research hypothesis, is aligned with researchers’ political ideals, or is exotic and attention-getting, rather than focusing on data that is representative of the results. The practice of anecdotalism is at the foundation of some people’s perceptions that qualitative research is not rigorous or methodologically sound. In reality, bad or sloppy qualitative research, including that suffering from anecdotalism, is not rigorous, just as bad quantitative research is also not rigorous.
Qualitative researchers must take care to present excerpts and examples from their data. When researchers do not do this and instead focus their write-up on summaries (or even numbers), readers are not able to draw their own conclusions about whether the data supports the findings. Respondents’ actual words, words or images from documents, and ethnographers’ first-hand observations are the true strength of qualitative research and thus it is essential that these things come through in the final presentation. Plus, if researchers focus on summaries or numbers, they may miss important nuances in their data that could more accurately shape the findings. On the other hand, researchers also must take care to avoid making overconclusions, or conclusions that go beyond what the data can support. Researchers risk making overconclusions when they assume data are representative of a broader or more diverse population than that which was included in the study, when they assume a pattern or phenomenon they have observed occurs in other types of contexts, and in similar circumstances when limited data cannot necessarily be extended to apply to events or experiences beyond the parameters of the study.
Another risk in qualitative research is that researchers might underemphasize theory. The role of theory marks one of the biggest differences between social science research and journalism. By connecting data to theory, social scientists have the ability to make broader arguments about social process, mechanisms, and structures, rather than to simply tell stories. Remember that one common goal in social science research is to focus on ordinary and everyday life and people, showing how—for instance—social inequality and social organizations structure people’s lives, while journalism seeks stories that will draw attention.
Thinking Like a Researcher
This chapter has highlighted a variety of strategies for moving from data to conclusions. In the quantitative research process, moving from data to conclusions really is the analysis stage of research. But in qualitative research, especially inductive qualitative research, the process is more iterative, and researchers move back and forth between data collection, data management, data reduction, and analysis. It is also important to note that the strategies and tools outlined here are only a small sampling of the possible analytical techniques qualitative researchers use—but they provide a solid introduction to the qualitative research process. As you practice qualitative research and develop your expertise, you will continue to find new approaches that better fit your data and your research style.
So what ties all of these approaches to qualitative data analysis together? Among the most important characteristics is that the data needs to speak for itself. Yes, qualitative researchers may engage in data reduction due to the volume and complexity of the data they have collected, but they need to stay close enough to the data that it continues to shape the analysis and come alive in the write up.
Another very important element of qualitative research is reflexivity. Reflexivity, in the context of social science research, refers to the process of reflecting on one’s own perspective and positionality and how this perspective and positionality shape “research design, data collection, analysis, and knowledge production” (Hsiung 2008:212). The practice of reflexivity is one of the essential habits of mind for qualitative researchers. While researchers should engage in reflexivity throughout the research process, it is important to engage in a specifically reflexive thought process as the research moves towards conclusions. Here, researchers consider what they were thinking about their project, methodology, theoretical approach, topic, question, and participants when they began the research process, how these thoughts and ideas have or have not shifted, and how these thoughts and ideas—along with shifts in them—might have impacted the findings (Taylor, Bogdan, and DeVault 2016). They do this by “turn[ing] the investigative lens away from others and toward themselves” (Hsiung 2008:213), taking care to remember that the data they have collected and the data reduction and analysis strategies they have pursued result in records of interpretations, not clear, objective facts. Some feminist reflexive approaches involve talking through this set of concepts with participants; reflexive research may also involve having additional researchers serve as a kind of check on the research processes to ensure they comport with researchers’ goals and ethical priorities (Grbich 2007).
Adjusting to the qualitative way of thinking can be challenging. New researchers who are accustomed to being capable students are generally used to being good at what they do—getting the right answers on tests, finding it easy to write papers that fulfill the professor’s requirements, and picking up material from lectures or reading without much difficulty. Thus, they may end up thinking that if something is hard, they are probably falling short. And those who are accustomed to thinking o themselves as not such good students are often used to finding many of these academic activities hard and assuming that the fault lies within themselves. But one of the most important lessons we can learn from doing social science research is that neither of these sets of assumptions is accurate. In fact, doing research is hard by definition, and when it is done right, researchers are inevitably going to hit many obstacles and will frequently feel like they do not know what they are doing. This is not going to be because there is something wrong with the researcher! Rather, this is because that is how research works, because research involves trying to answer a question no one has answered before by collecting and analyzing data in a way no one has tried before. In Martin Schwartz’s (2008:1771) words, faculty like those of us writing this book and teaching your class have been doing students a disservice by not making students “understand how hard it is to do research” and teaching them how we go about “confronting our absolute stupidity,” the existential ignorance we all have when trying to understand the unknown. Schwartz says this kind of ignorance, which we choose to engage in when we pursue research, is highly productive, because it drives us to learn more. And that, after all, is the real point of research.
Exercises
- Ask three friends or acquaintances to tell you what steps they took to get their most recent job. Create a process diagram of the job-searching process.
- Create a network diagram of your class, with nodes representing each student and edges reflecting whether students knew one another before the semester began (or perhaps whether they are taking multiple courses together this semester).
- Using a textual or video interview with a celebrity as your data (be sure it is an interview and not an article summarizing an interview), write a narrative case study of that celebrity’s life, being sure to reference sociological concepts where appropriate.
- Locate a work of long-form journalism about a topic of social science interest. Good publications to explore for this purpose include The Atlantic, The New Yorker, The New York Times Magazine, Vanity Fair, Slate, and longreads.com, among others. Summarize how the article might be different if it were an example of social science rather than journalism—what theory or theories might it draw on? What types of scholarly sources might it cite? How might its data collection have been different? How might data analysis have been conducted? What social science conclusions might it have reached?
- Drawing on the “Conceptual Baggage Inventory Chart,” (Hsiung 2008:219), identify your own research interests and goals; biographical characteristics; beliefs, values, and ideologies; and position in structures of stratification (including, but not limited to, race, gender, class, sexuality, age, and disability). Then consider how each of these might serve as potential advantages and as potential disadvantages in carrying out research design, data collection, and data analysis.
Media Attributions
- Process Diagram of Post-High-School Pathways © Mikaila Mariel Lemonik Arthur is licensed under a CC BY-NC-SA (Attribution NonCommercial ShareAlike) license
- Social-network © By Wykis - Own work is licensed under a Public Domain license
- Edin 2000 Excerpt © Kathryn Edin is licensed under a All Rights Reserved license
The point in the research process where continuing to engage in data collection no longer yields any new insights. Can also be used to refer to the same point in the literature review process.
A relationship between two phenomena where one phenomenon influences, produces, or alters another phenomenon.
The situation in which variables are able to be shown to be related to one another.
The order of events in time; in relation to causation, the fact that independent variables must occur prior to dependent variables.
In relation to causation, the requirement that for a causal relationship to exist, all possible explanations other than the hypothesized independent variable have been eliminated as the cause of the dependent variable.
Tables, diagrams, figures, and related items that enable researchers to visualize and organize data in ways that permit the perception of patterns, comparisons, processes, or themes.
Visualizations that display the relationships between steps in a process or procedure.
A visualization of the relationships between people, organizations, or other entities.
Visualizations of the relationships between ideas.
A diagram that lays out the steps taken to reach decisions.
A diagram of a sequence of operations or relationships.
Points in a network diagram that represents an individual person, organization, idea, or other entity of the type the diagram is designed to show connections between.
The line connecting nodes in a network diagram; such lines represent real-world relationships or linkages.
A diagram, usually a flow chart, that documents the hierarchy and reporting relationships within an organization.
An exclusive circle of people or organizations in which all members of the circle have connections to all other members of the circle.
Tables with rows and columns that are used to summarize and analyze or compare data.
A display that uses rows and columns to show information.
A diagram that lays out events in order of when they occurred in time.
A list or diagram of events in order of their occurrence in time.
A detailed narrative account of social action that incorporates rich details about context and meaning such that readers are able to understand the analytical meaning of the description.
An inductive approach to data collection and data analysis in which researchers strive to generate a conception of how participants understand their own lives and circumstances.
The hypothesis that there is no relationship between the variables in question.
A case that appears to be an exception to commonly-understood patterns or explanations.
The extent to which measures appear to measure that which they were intended to measure.
The term used to refer to relationship where variables seem to vary in relation to one another, but where in fact no causal relationship exists.
Repeating a research study with different participants.
The extent to which multiple raters or coders assign the same or a similar score, code, or rating to a given text, item, or circumstance.
The degree to which the characteristics of a sample resemble those of the larger population.
When research participants modify their behavior, actions, or responses due to their awareness that they are being observed.
When researchers choose particular stories or incidents specifically to illustrate a point rather than because they are representative of the data in general.
A continual reflection on the research process and the researcher's role within that process designed to ensure that researchers are aware of any thought processes that may impact their work.
An individual's social, cultural, and political location in relation to the research they are doing.
