Quantitative Data Analysis
2 Preparing Quantitative Data and Data Management
Mikaila Mariel Lemonik Arthur
The process of research design and data collection is beyond the scope of this book, but it is worth spending some time on the steps required to get quantitative data ready for data analysis. Social science researchers who are working with quantitative data may have collected that data themselves, or they may have obtained that data from another researcher or from a data repository such as the General Social Survey, a national census bureau or other government data source (e.g. the U.S. Census Bureau), or the Institute for Social Research at the University of Michigan. Preparing data for analysis requires different steps depending on the initial source and format of the data.
When a researcher has collected their own data, they need to enter that data into a computer file in a machine-readable format. Some online survey software systems permit survey data to be downloaded in an appropriate format, but not all do—and if data was collected on paper or face-to-face, it needs additional processing. Typically, research teams enter data into a spreadsheet program like Microsoft Excel or Google Sheets. But doing so requires the creation of a codebook, or a document in which numerical codes are assigned to all answer choices or data entry elements.
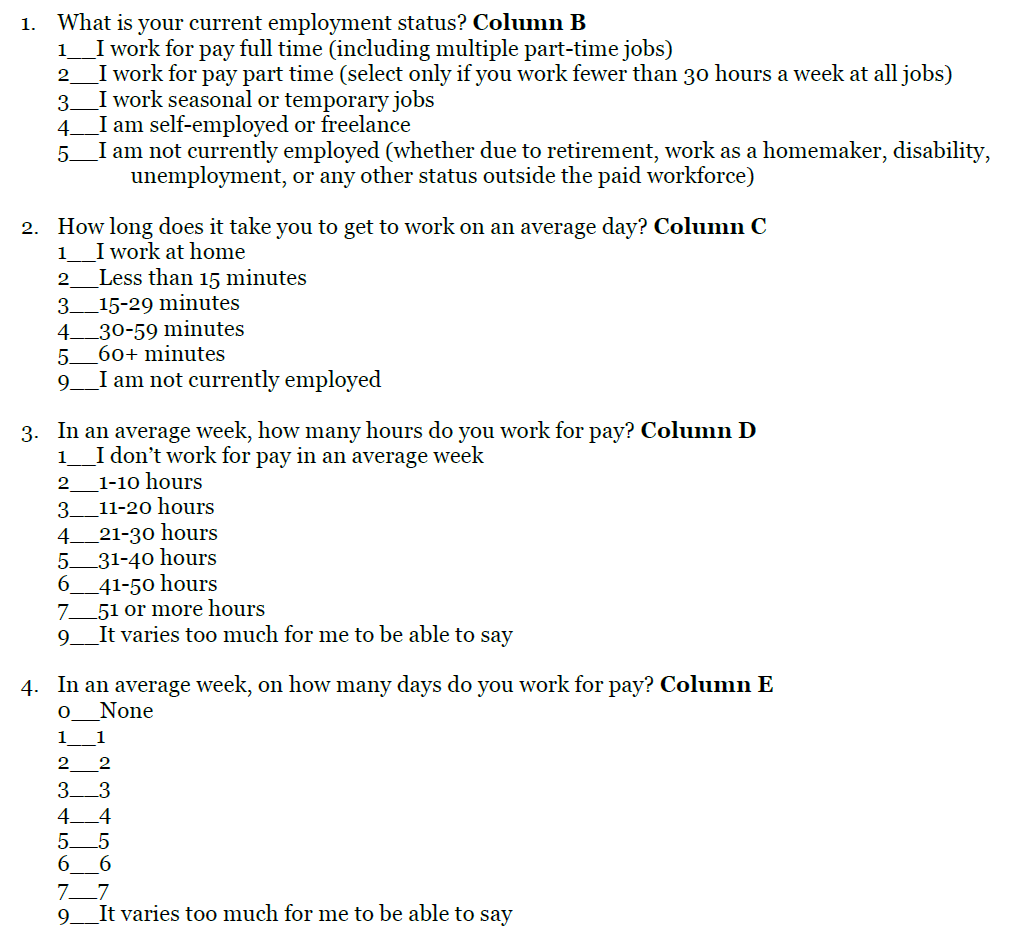
Figure 1 provides an example of what a codebook for survey data entry might look like, drawing on a survey a group of students created and administered as part of a research methods course. Each question is assigned a column, and each answer choice is assigned a numerical code, with a special code for missing or unusable data (often 9, 99, 999, or -1). Note that in circumstances where a survey question asked respondents to “check all that apply,” each answer choice must be converted into a separate question, with selected and not selected as the coded answer choices. This is one reason why downloaded survey data must often still be prepared for use, as survey software like Google Forms may not reliably process “check all that apply” questions or automatically convert multiple-choice questions to the type of numeric answers statistical software requires.
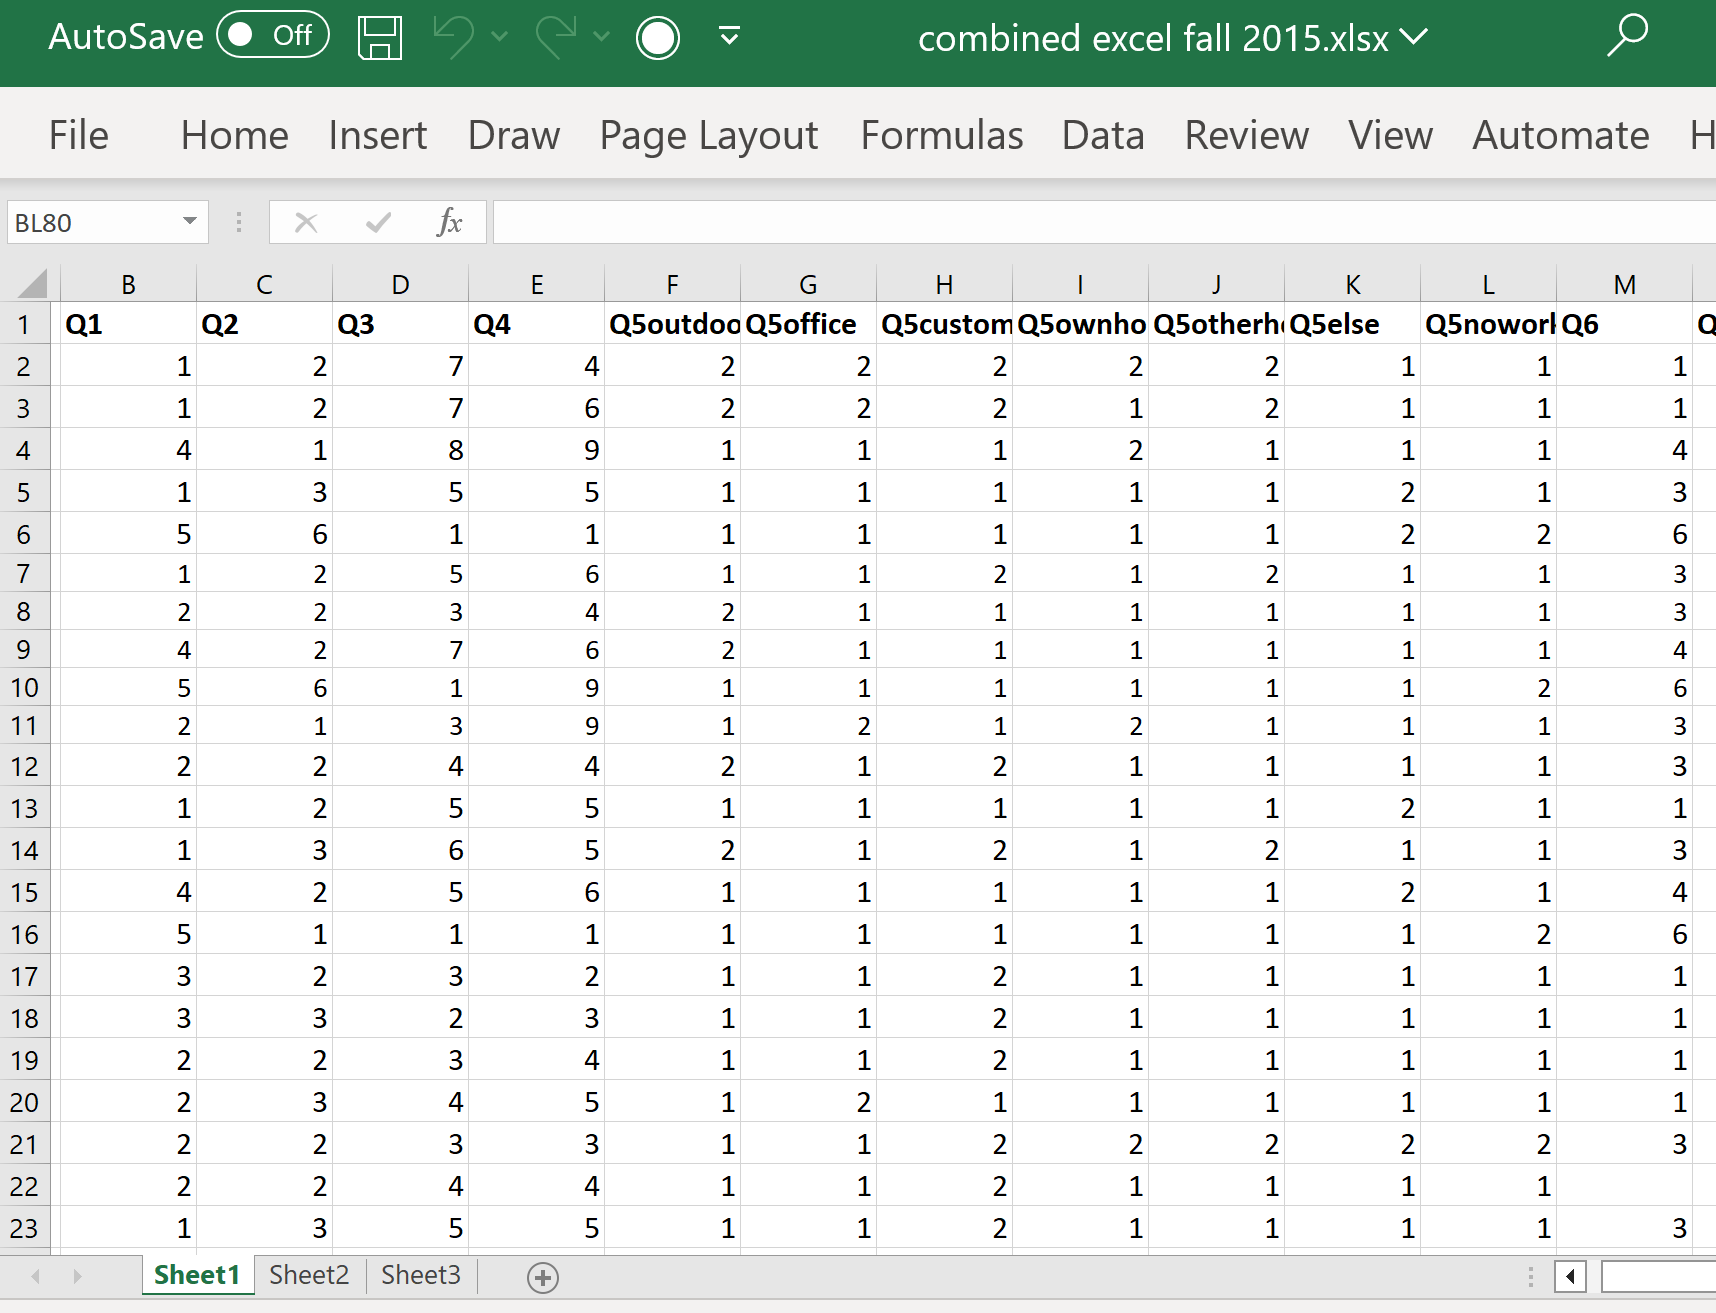
Figure 2 shows what completed data entry might look like; it is taken from the same survey and shows the data after student survey-takers entered it into Excel. Each survey response, coded text, or other unit of analysis in the quantitative project has its data entered on a particular row. Note that without the codebook, it is not possible to understand the data displayed on the screen. When researchers perform data analysis directly in spreadsheet software, they may need to rely on the codebook to convert data back and forth from machine-readable (numerical) codes to human-language response categories. However, when data is imported into statistical analysis software, codebook information can be entered directly into the software, as will be discussed in the chapter Quantitative Analysis with SPSS: Data Management.
When obtaining data from elsewhere, many sites will provide the option of downloading data in a variety of file formats. In that case, researchers should choose—if possible—the appropriate file format for the software they are using, and should also download any codebook, readme, or help files that will explain the data and coding. Sometimes data is not available in a given file format and will need to be converted or imported, which will be discussed in the chapter Quantitative Analysis with SPSS: Data Management.
Note that most statistical analysis software is not cloud-resident, so it is important that researchers save their datasets after creating, importing, or modifying them; keep good backups; and keep records of all tests and procedures run, modifications made, etc. during the data analysis process.
Data Cleaning & Working With Data
Aside from preparing data for analysis, the other crucial step researchers need to take prior to beginning their analysis is data cleaning. Data cleaning is the process of examining data to find any errors, mistakes, duplications, corruptions, omissions, or other issues. Where possible, researchers can correct these issues; in other cases, certain data may need to be omitted from analysis.
Researchers may also need to modify variables or datasets in various ways. For example, many studies involve the creation of an index variable, or a composite measure created by combining information from multiple variables. For example, a study might involve administering a self-esteem inventory consisting of a number of different multiple-choice questions getting at various elements of self-esteem. Then, researchers combine the answers to all of these questions using a scoring system to create one variable representing the score on the self-esteem index. In other cases, researchers need to reduce the number of response categories a variable has or convert a continuous variable into an ordinal variable. Or a researcher might be working with a dataset that includes respondents of all ages, but for a study only interested in 18-29 year olds, and thus may need to filter the dataset. As one final example, researchers may have data from the same study stored in multiple spreadsheets and may need to combine or merge that data.
These are only a few examples of the tasks researchers face. The practical how-to of carrying out these tasks will be discussed in the chapter Quantitative Analysis with SPSS: Data Management — but before trying to carry them out, researchers need to take the time to think through their projects, determine which steps are necessary, and plan carefully.
Exercises
- Write five basic multiple-choice survey questions (they do not have to be anything fancy–consider asking questions like age and favorite color). Create a codebook for your survey. Then, ask ten people you know to answer the questions, without using survey software. Finally, enter the data into Excel or another spreadsheet program of your choice, following your codebook.
- Choose one of the data sources noted at the top of this chapter. Visit the website for the data source and learn as much as you can about it, then write a paragraph summarizing how the data is collected and what the data focuses on.
Media Attributions
A composite variable created by combining information from multiple variables.
A variable measured using numbers, not categories, including both interval and ratio variables. Also called a scale variable.
A variable with categories that can be ordered in a sensible way.
