Quantitative Data Analysis With SPSS
10 Quantitative Analysis with SPSS: Getting Started
Mikaila Mariel Lemonik Arthur
This chapter focuses on getting started with SPSS. Note that before you can start to work with SPSS, you need to get your data into an appropriate format, as discussed in the chapter on Preparing Quantitative Data and Data Management. It is possible to enter data directly into SPSS, but the interface is not conducive to data entry and so researchers are better off entering their data using a spreadsheet program and then importing it.
Importing Data Into SPSS
In some cases, existing data will be able to be downloaded in SPSS format (*.sav is the file extension for an SPSS datafile), in which case it can be opened in SPSS by going to File → Open → Data and then locating the location of the file. However, in most cases, researchers will need to import data stored in another file format into SPSS. To import data, go to the file menu, then select import data. Next, choose the type of data you wish to import from the menu that appears. In most cases, researchers will be importing Excel or CSV data (when they have entered it themselves or are downloading it from a general-purpose site like the Census Bureau) or SAS or Stata data (when they are downloading it from a site that makes prepared statistical data files available).
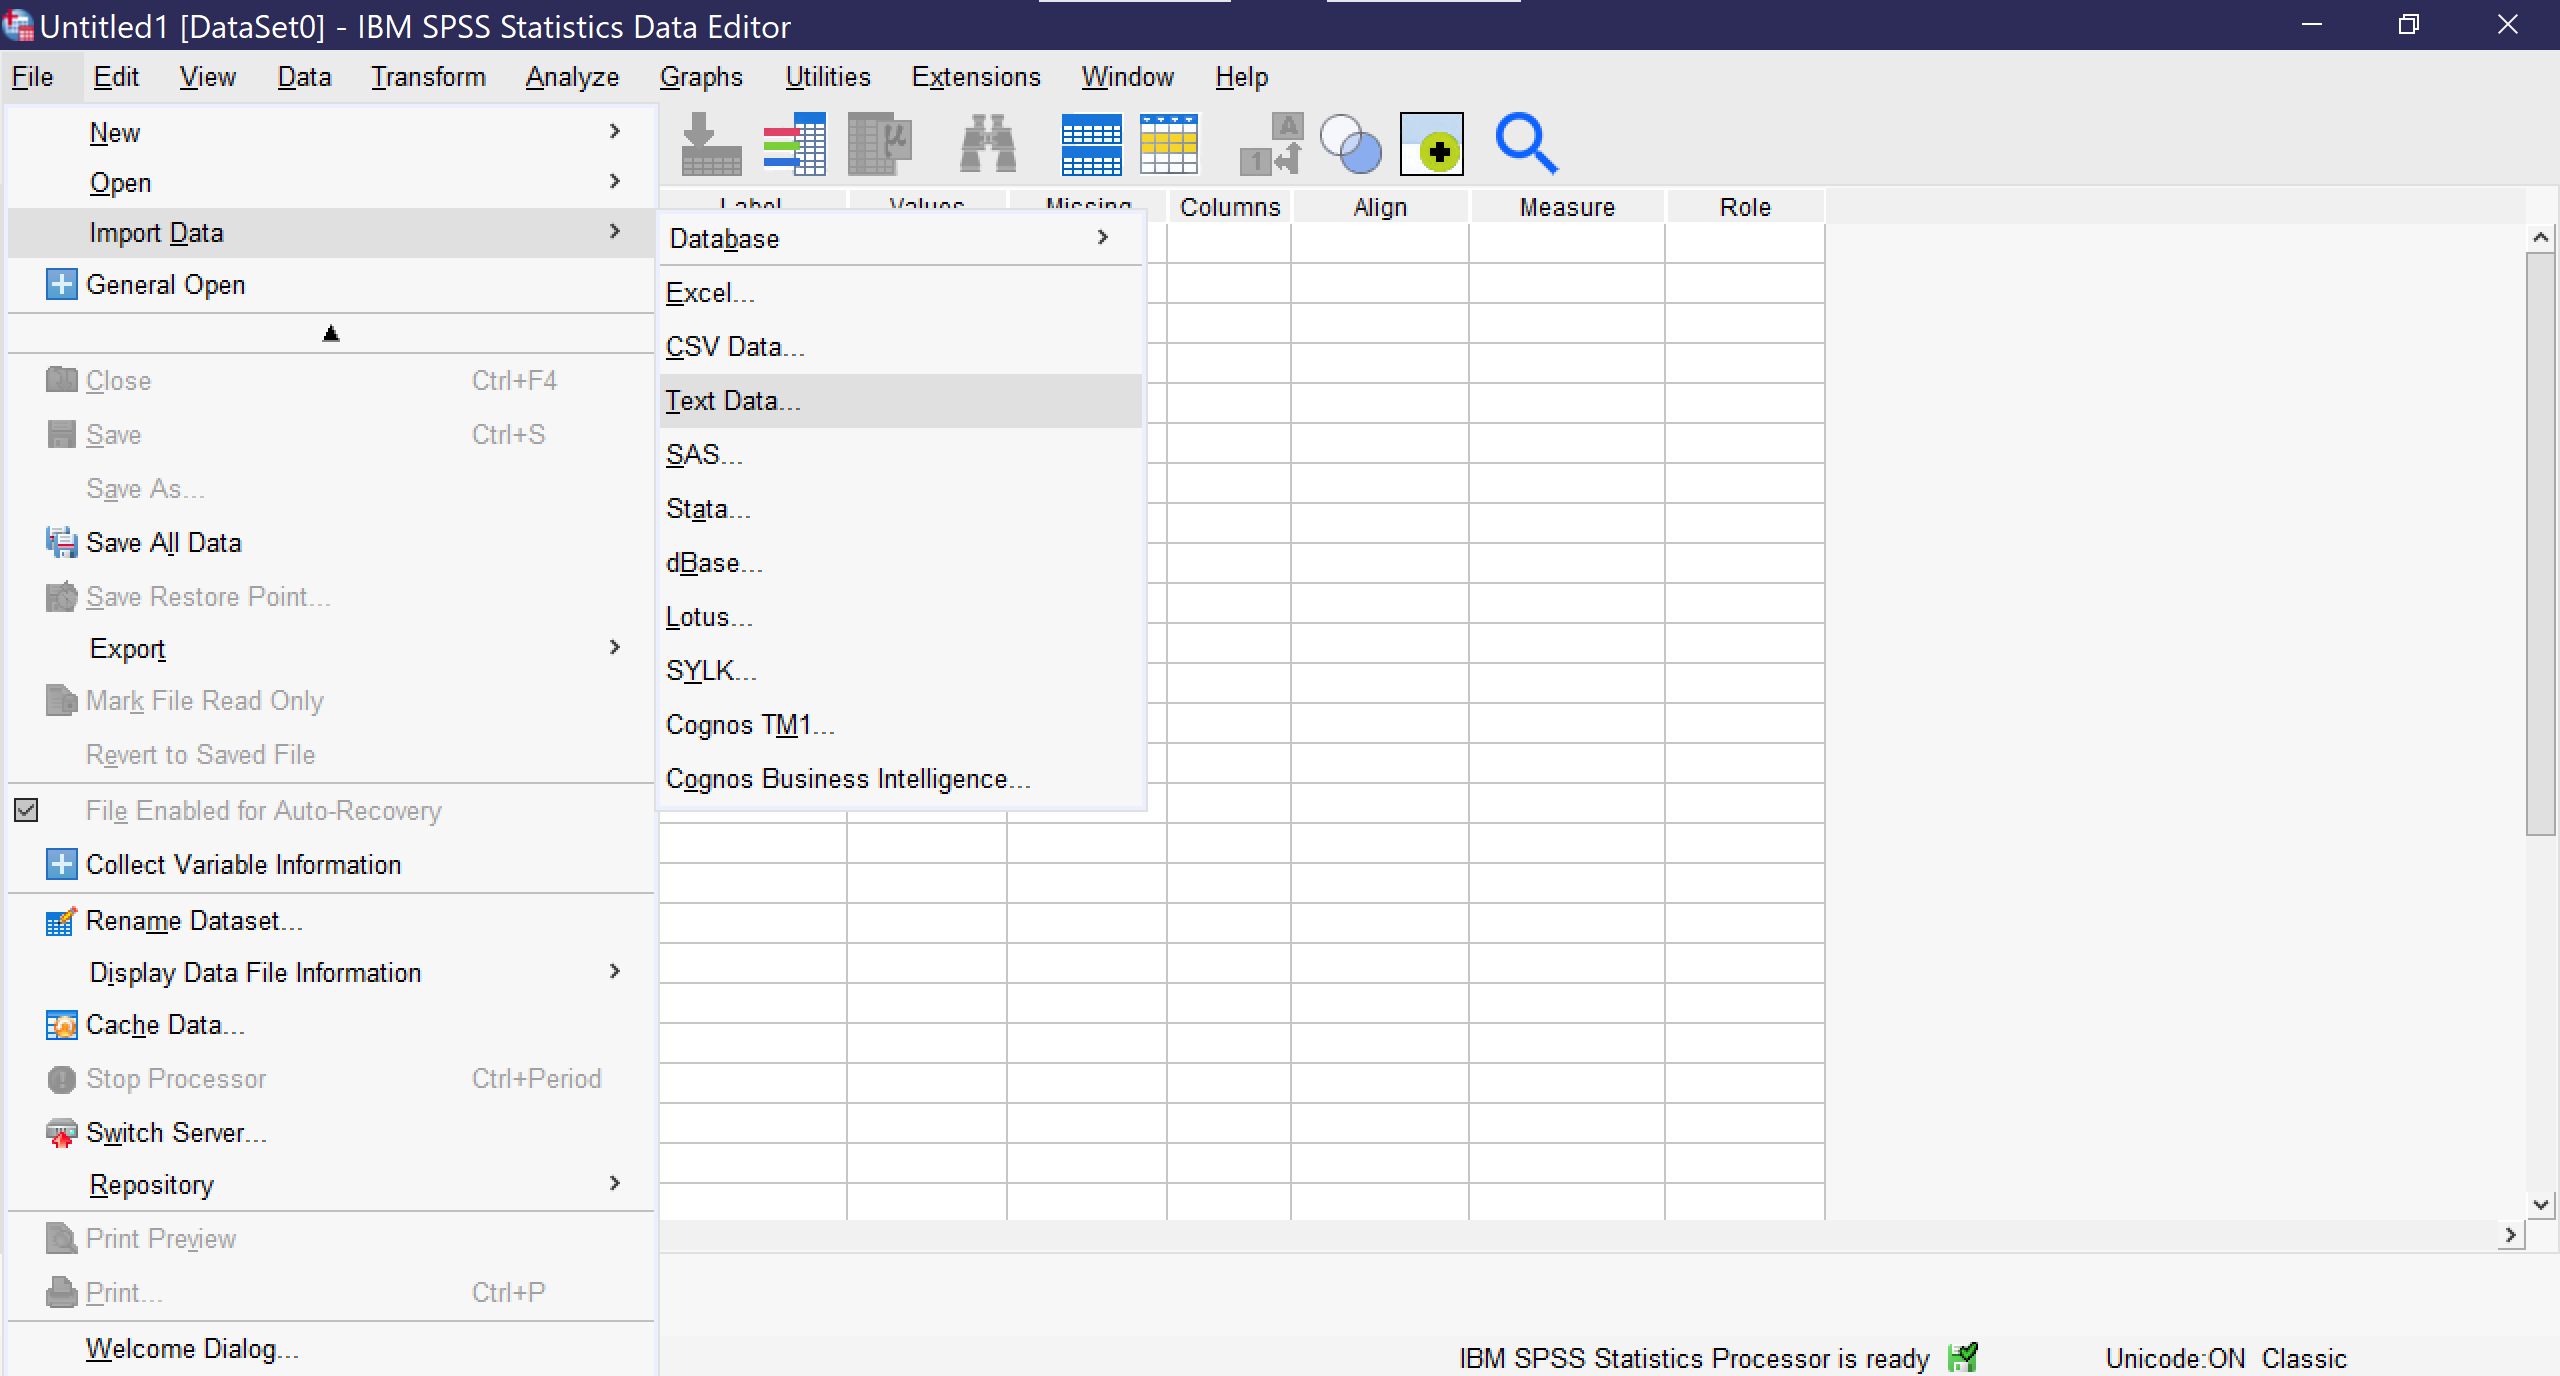
Once you click on a data type, a window will pop up for you to select the file you wish to import. Be sure it is of the file type you have chosen. If you import a file in a format that is already designed to work with statistical software, such as Stata, the importation process will be as seamless as opening a file. Researchers should be sure that immediately after importing, they save their file (File → Save As) so that it is stored in SPSS format and can be opened in SPSS, rather than imported, in the future. It is essential to remember that SPSS is not cloud-resident software and does not have an autosave function, so any time a file is changed, it must be manually saved.
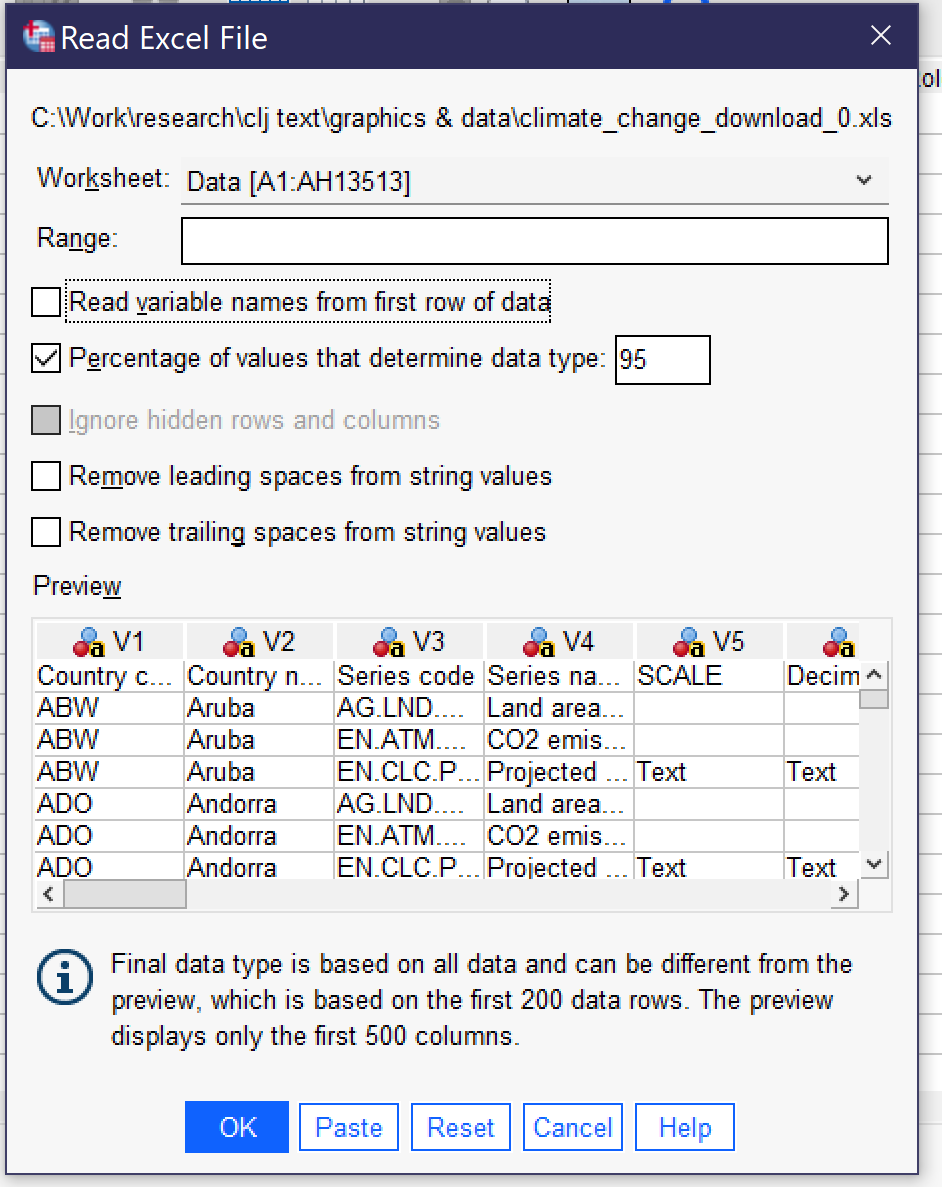
If you import a file in Excel, CSV (comma-separated values) or text format, SPSS will open an import wizard with a number of steps. The steps vary slightly depending on which file type you are importing. For instance, to import an Excel file, as shown in Figure 2, you first need to specify the worksheet (if the file has multiple worksheets—SPSS can only import one worksheet at a time). You can choose to specify a limited range of cells. Checking the checkbox next to “Read variable names from first row of data” will replace the V1, V2, V3, and so on column headers with whatever appears in the top row of data in the Excel file. You can also choose to change the percentage of values that are used to determine data type, remove leading and trailing spaces from string values, and—if your Excel file has hidden rows or columns—you can choose to ignore them. Below the options, a preview of your Excel file will be shown; you can scroll through the preview to see that data is being displayed correctly. Clicking OK will finalize the import.
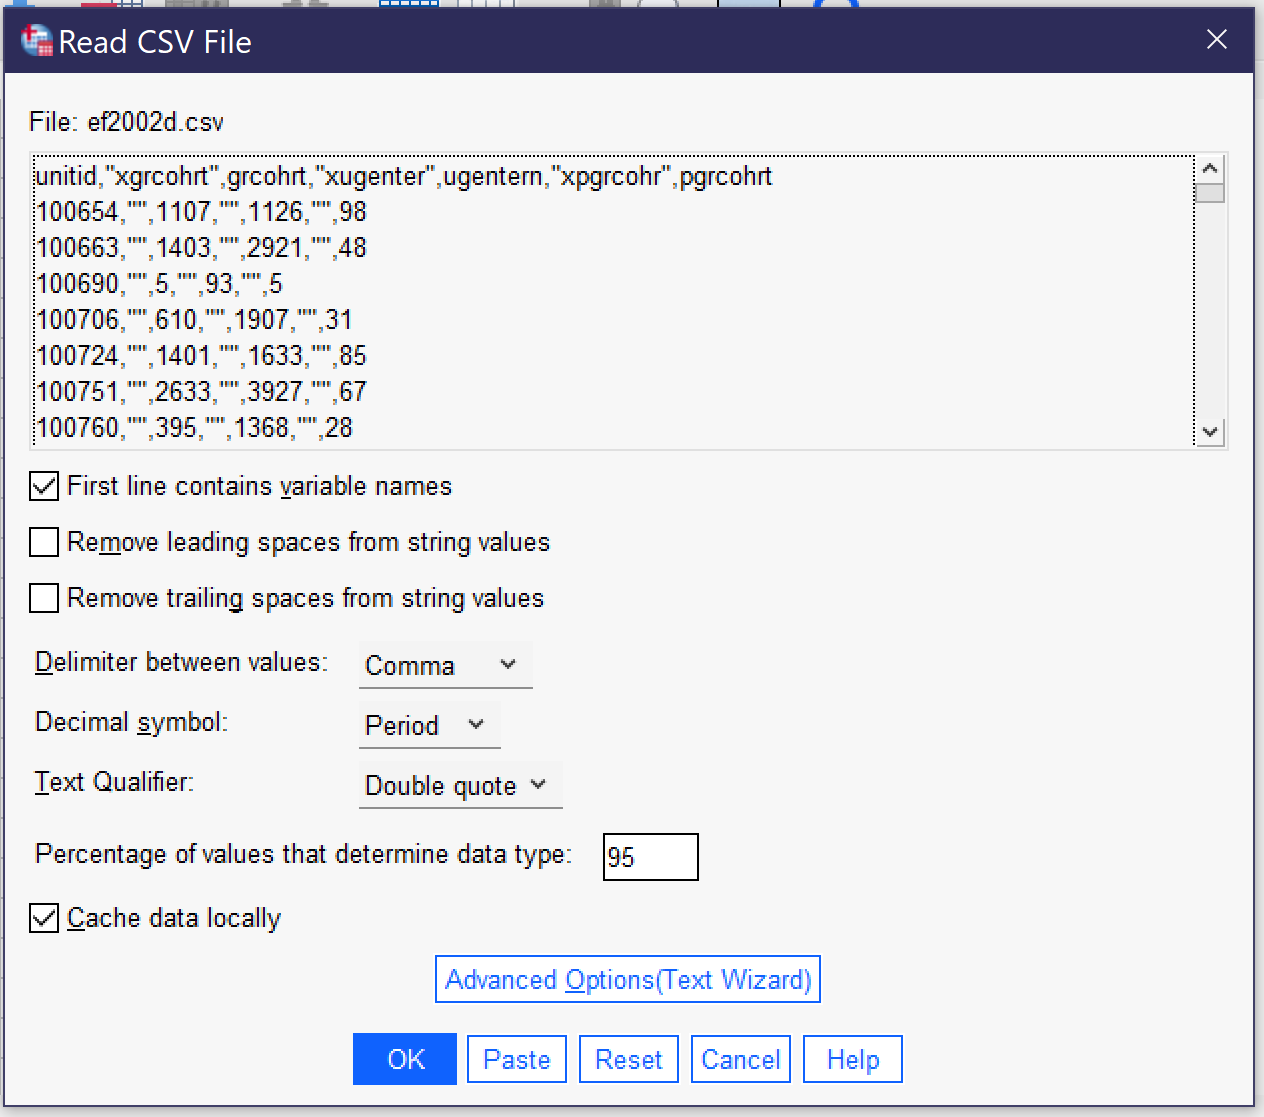
A different set of options appears when you import a CSV file, as shown in Figure 3. The top of the popup window shows a preview of the data in CSV format. While toggles related to whether the first line contains variable names, removing leading and trailing spaces, and indicating the percentage of values that determine the data type are the same as for importing data from Excel, there are additional options that are important for the proper importing of CSV data. First of all, the user must specify whether values are delimited by a comma, a semicolon, or a tab. While commas are the most common delimiters in CSV files, the other delimiters are possible, and looking at the preview should make clear which of the delimiters is being used in a given file, as shown in the example below.
| Comma-delimited: |
1,2312,"Yes",984 |
| Semicolon-delimited: |
1;2312;"Yes";984 |
| Tab-delimited: |
1 2312 "Yes" 984 |
Second, the user must specify whether the period or the comma is the decimal symbol. Data produced in the United States typically uses the period (as in 1238.67), as does data produced in many other English-speaking countries, while most of Europe and Latin America use the comma. Third, the user must specify the text qualifier (single quotes, double quotes, or none). This is the character used to note that the contents of a particular entry in the CSV file are textual (string variables) in nature, not numerical. If your data includes text, it should be clear from the preview which qualifier is being used. Users can also toggle whether data is cached locally or not; caching locally speeds the importation process.
Finally, there is a button for Advanced Options (Text Wizard). The text wizard offers the same window and options that users see if they are importing a text file directly, and this wizard offers more direct control over the importation process over a series of six steps. First, users can specify a predefined format if they have a *.tpf file on their computers (this is rare) and see a preview of what the data in the file looks like. In step two, they can indicate if the file is delimited (as above) or fixed-width (where values are stored in columns of constant size specified within the file); which—if any—row contains the variable names; and the decimal symbol. Note that some forms of fixed-width files may not be supported. Third, they indicate which line of the file contains the first line of data, whether each line represents a case or a specific given number of variables represents a case, and how many cases to import. This last choice includes the option to import a random sample of cases. Fourth, users specify the delimiter and the text qualifier and determine how to handle leading and trailing spaces in string values. Fifth, users can double-check variable names and formats. Finally, before clicking the “Finish” button, users can choose to save their selections as a *.tpf file to be reused or to paste the syntax (to be discussed later in this chapter).
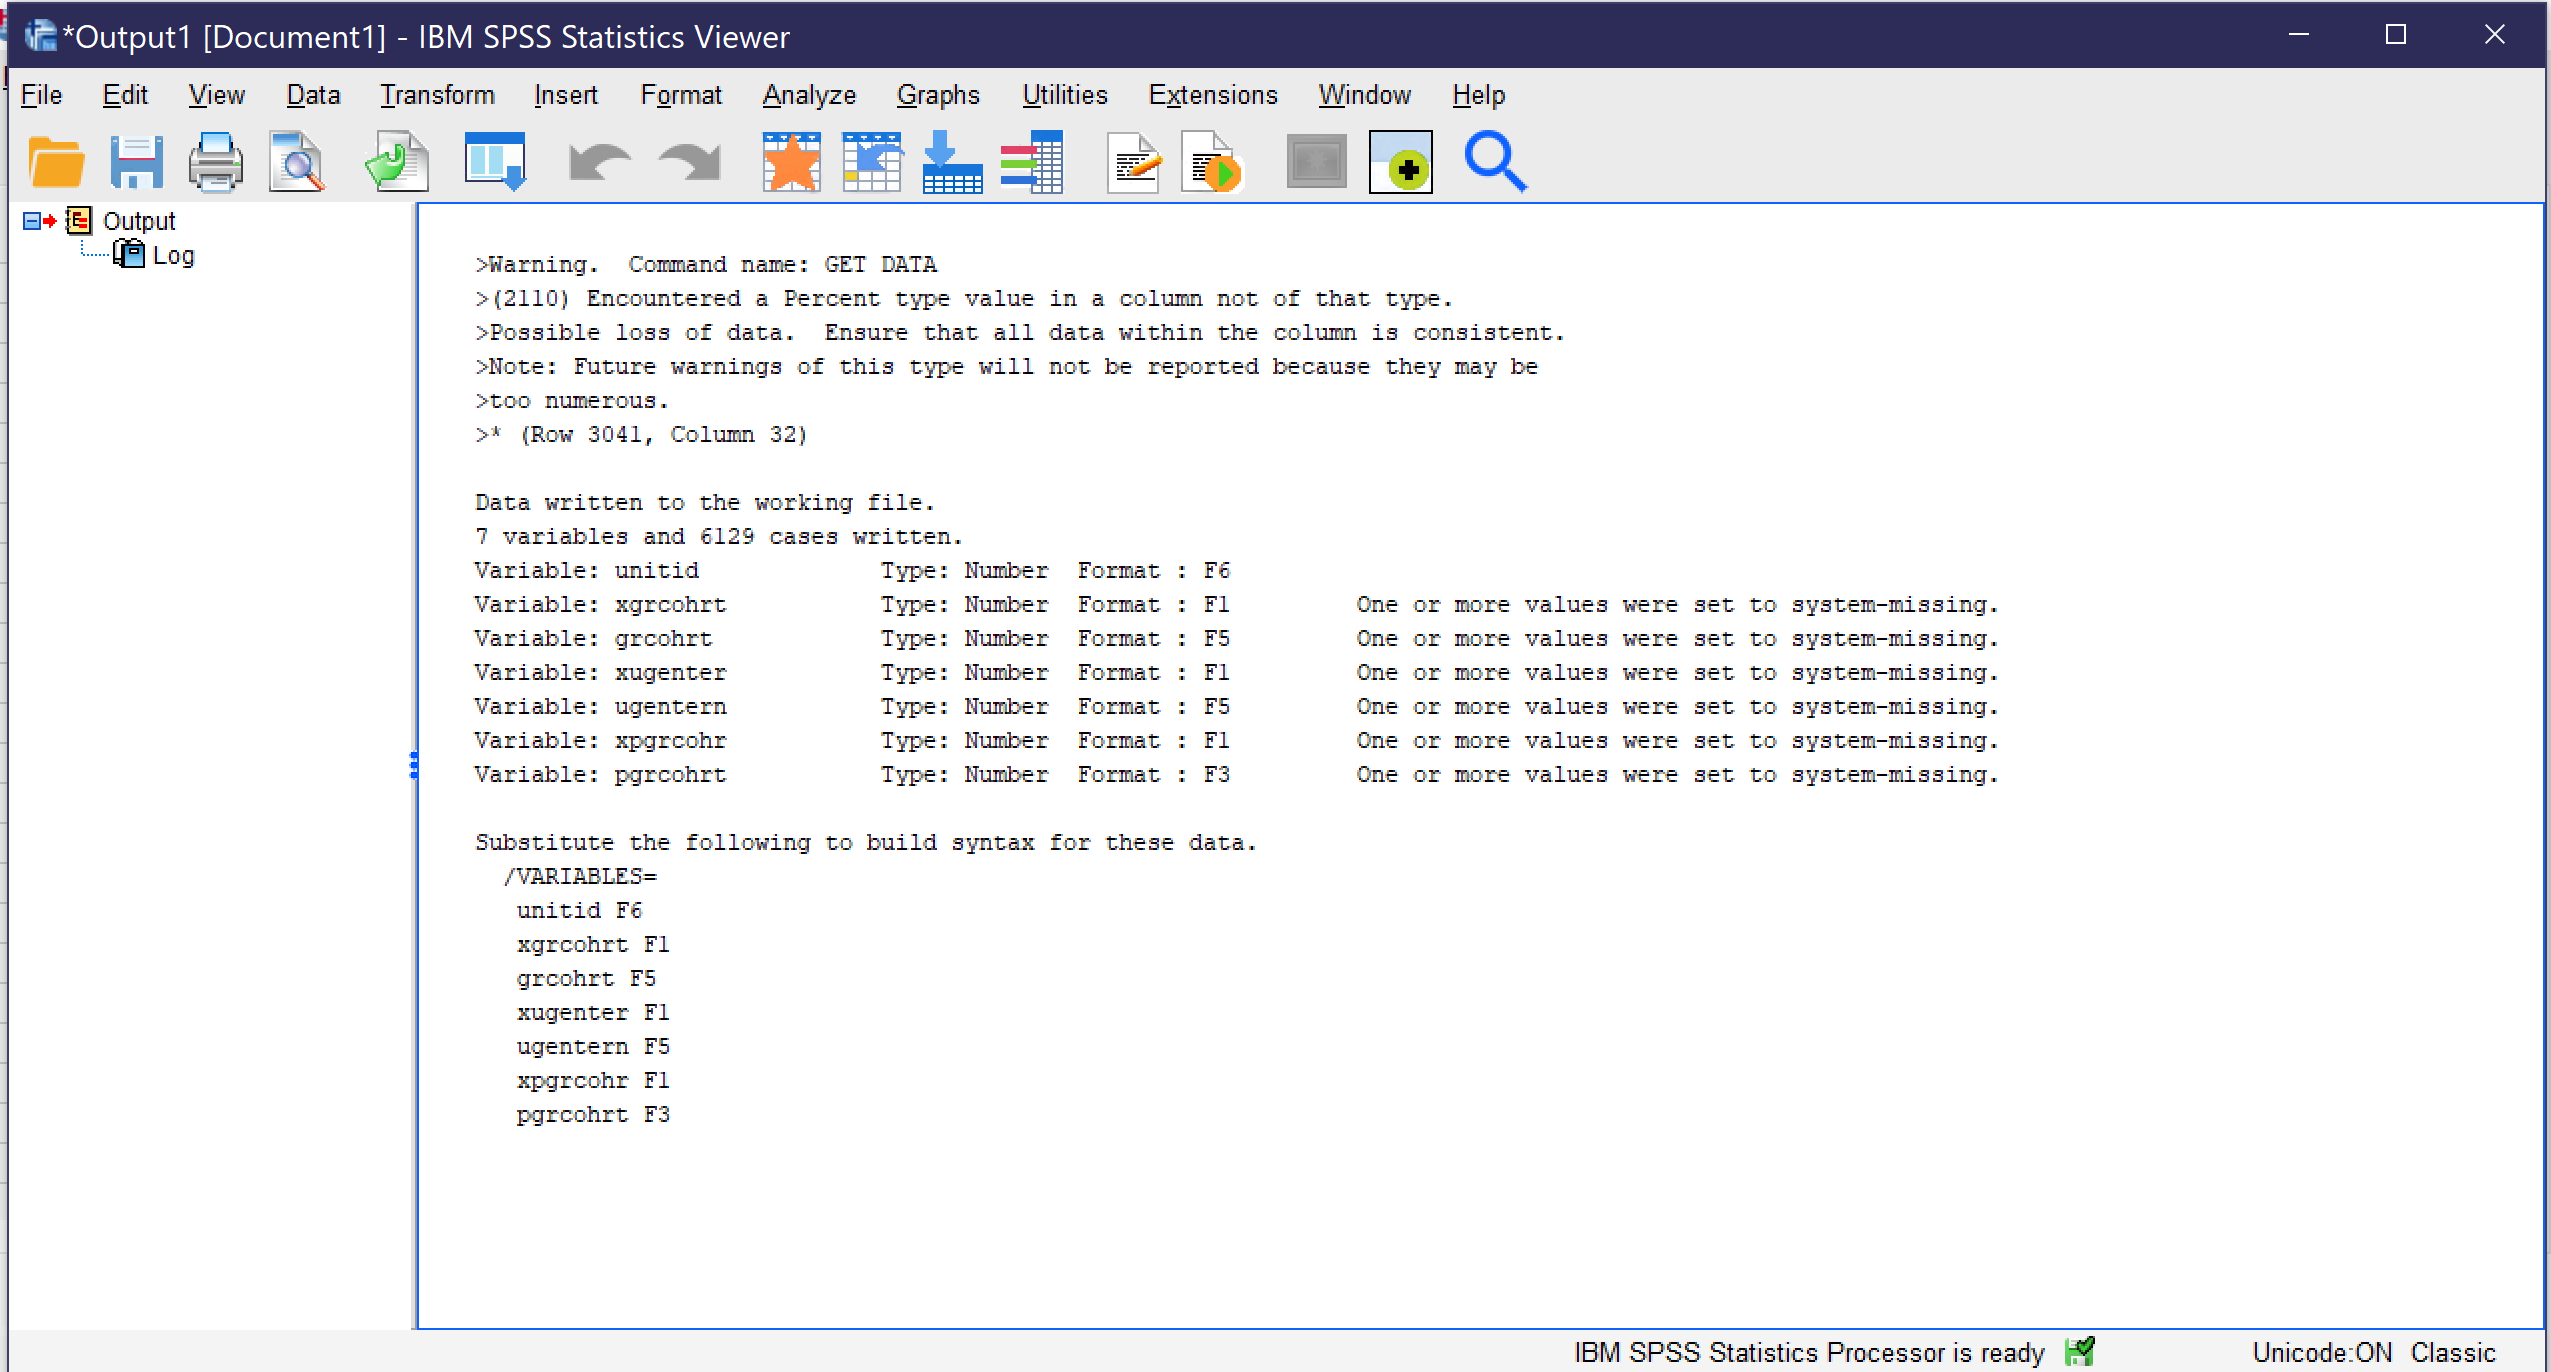
In all cases, once the importation options have been selected and OK or Finish has been clicked, the data is imported. An output window (see Figure 4) may open with various warnings and details about the importation process, and the Data View window (see Figure 5) will show the data, with variable names at the top of each column. At this point, be sure to save the dataset in a location and with a name you will be able to locate later.
 |
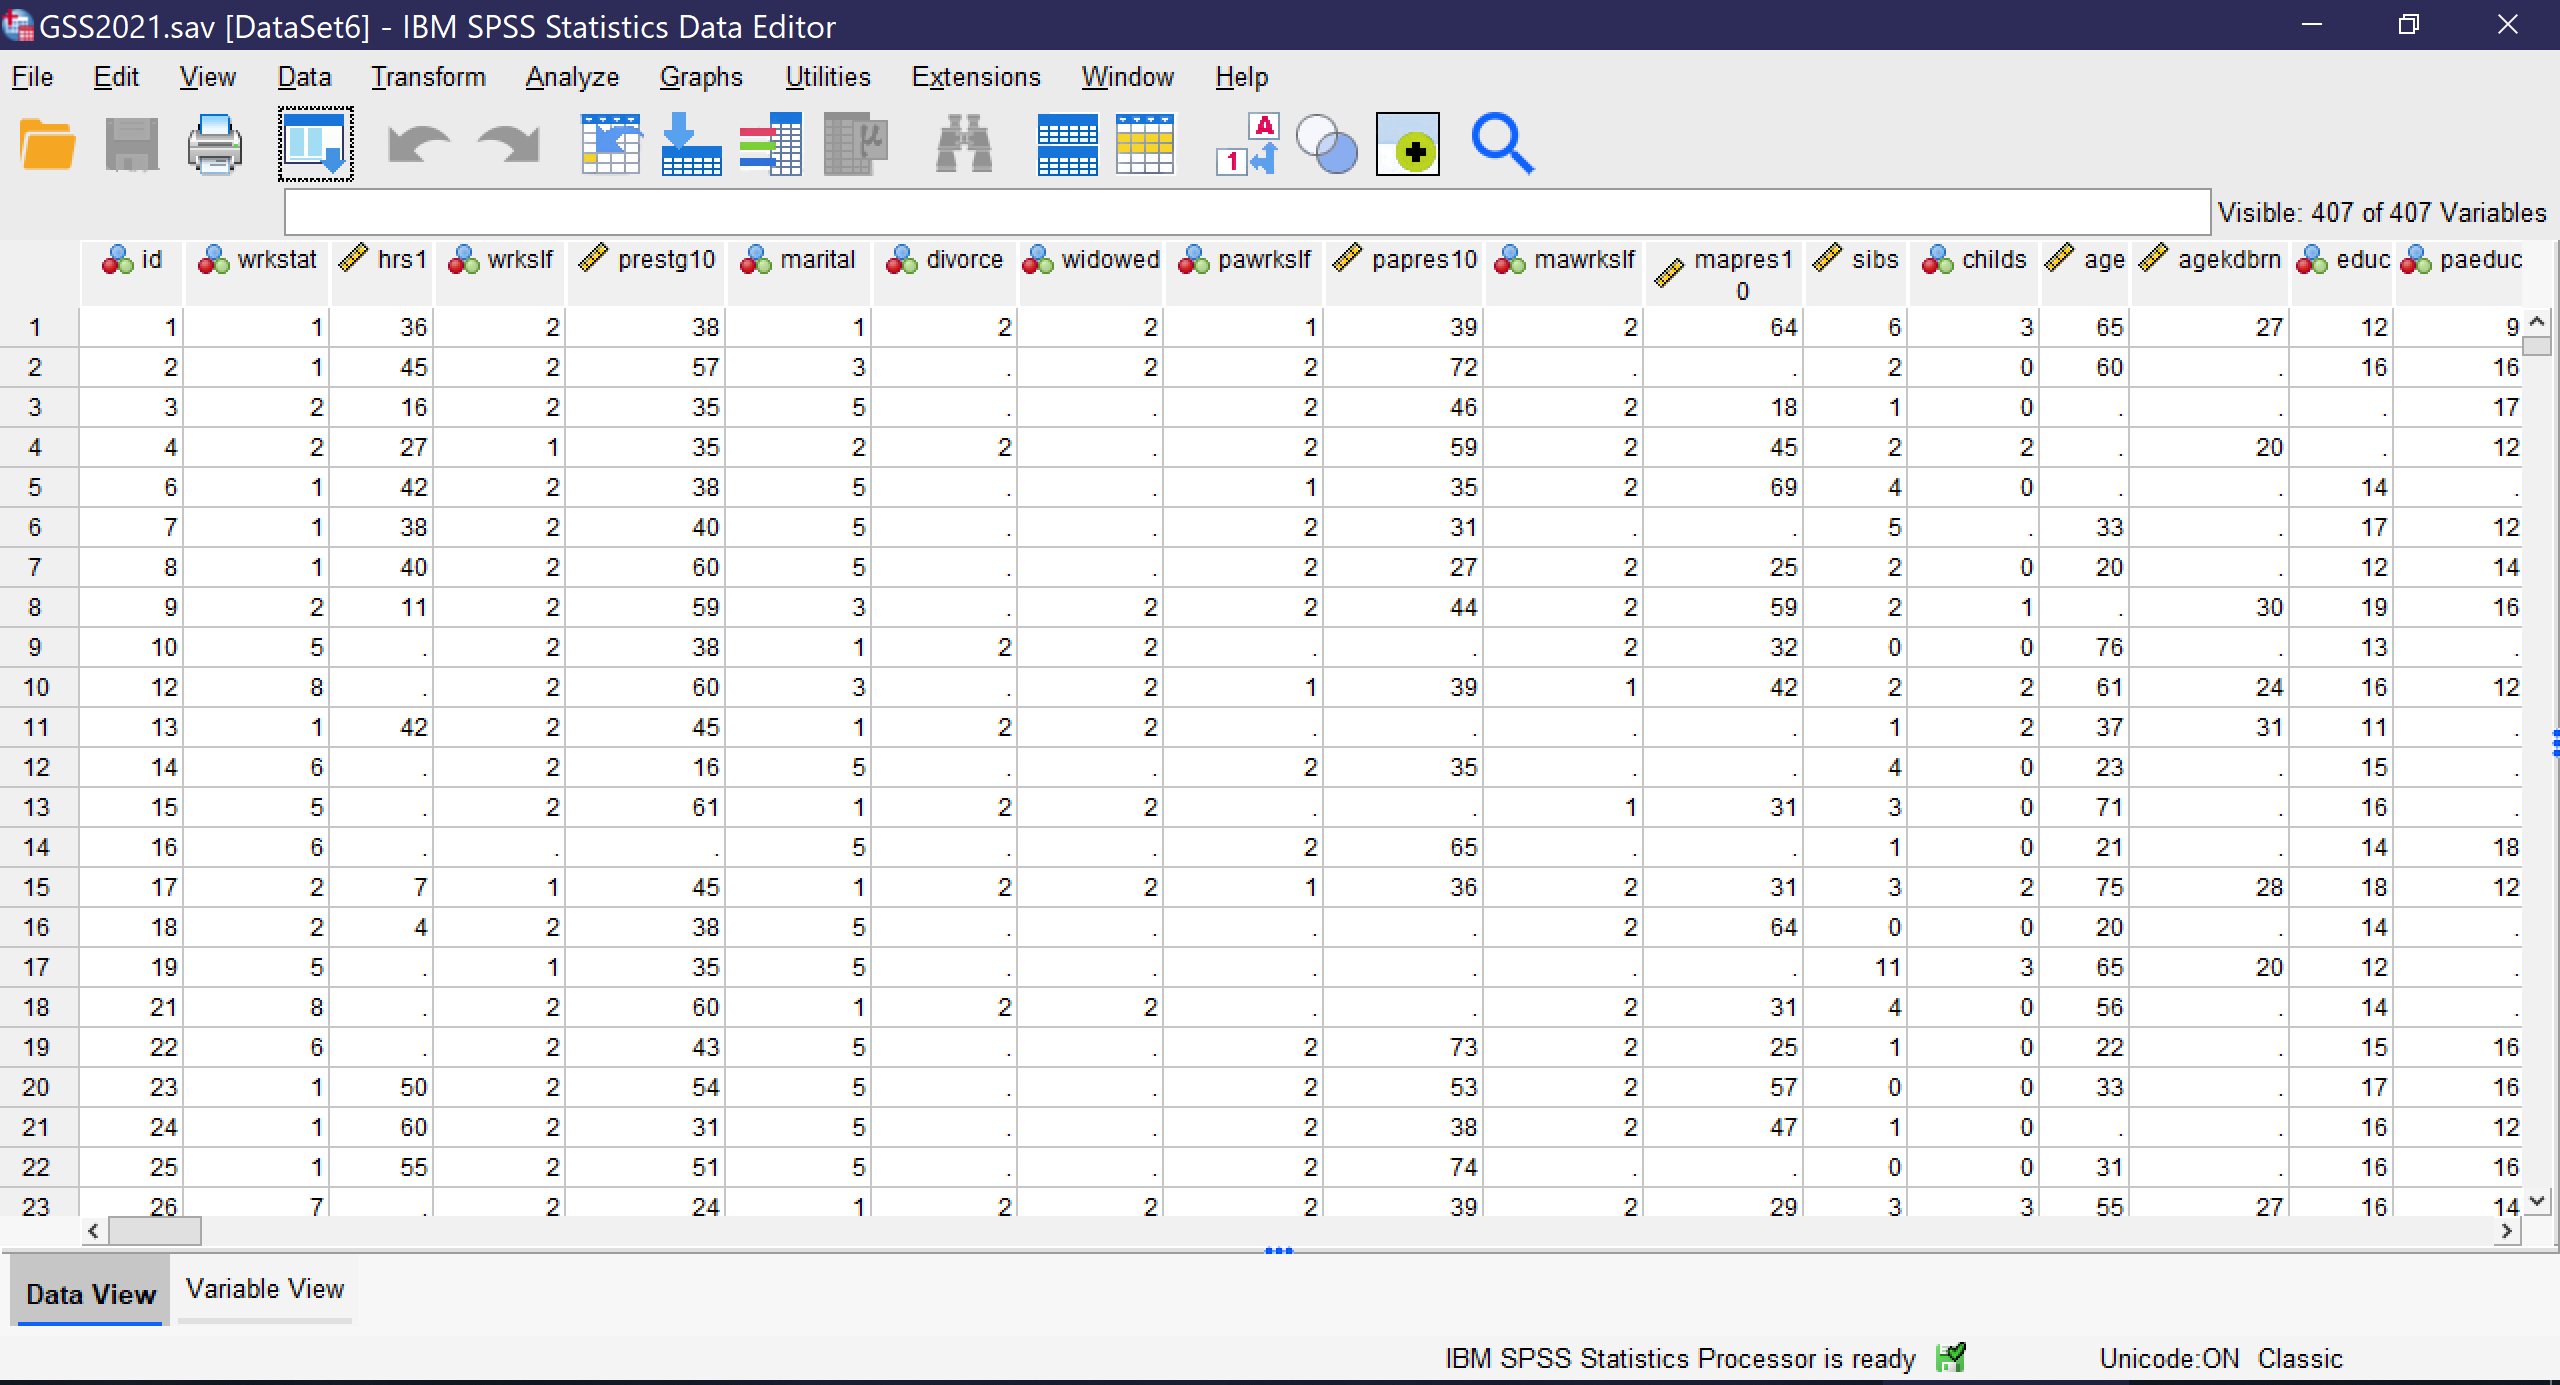 |
Before users are done setting up their dataset, they must be sure that appropriate variable information is included. When datasets are imported from other statistical programs, they will typically come with variable information. But when they are imported from Excel or CSV files, the variable information must be manually entered, typically from a codebook or related document. Variable information is entered using Variable View. Users can switch between Data View and Variable View by clicking the tabs at the bottom of the screen or using the Ctrl+T key combination. As you can see in Figure 6, a screenshot of a completed dataset, Variable View shows each variable in a row, with a variety of information about that variable. When a dataset is imported, each of these pieces of information need to be entered by hand for each variable. To move between columns by key commands, use the tab key; to open variable information that requires a menu for entry, click the space bar twice.
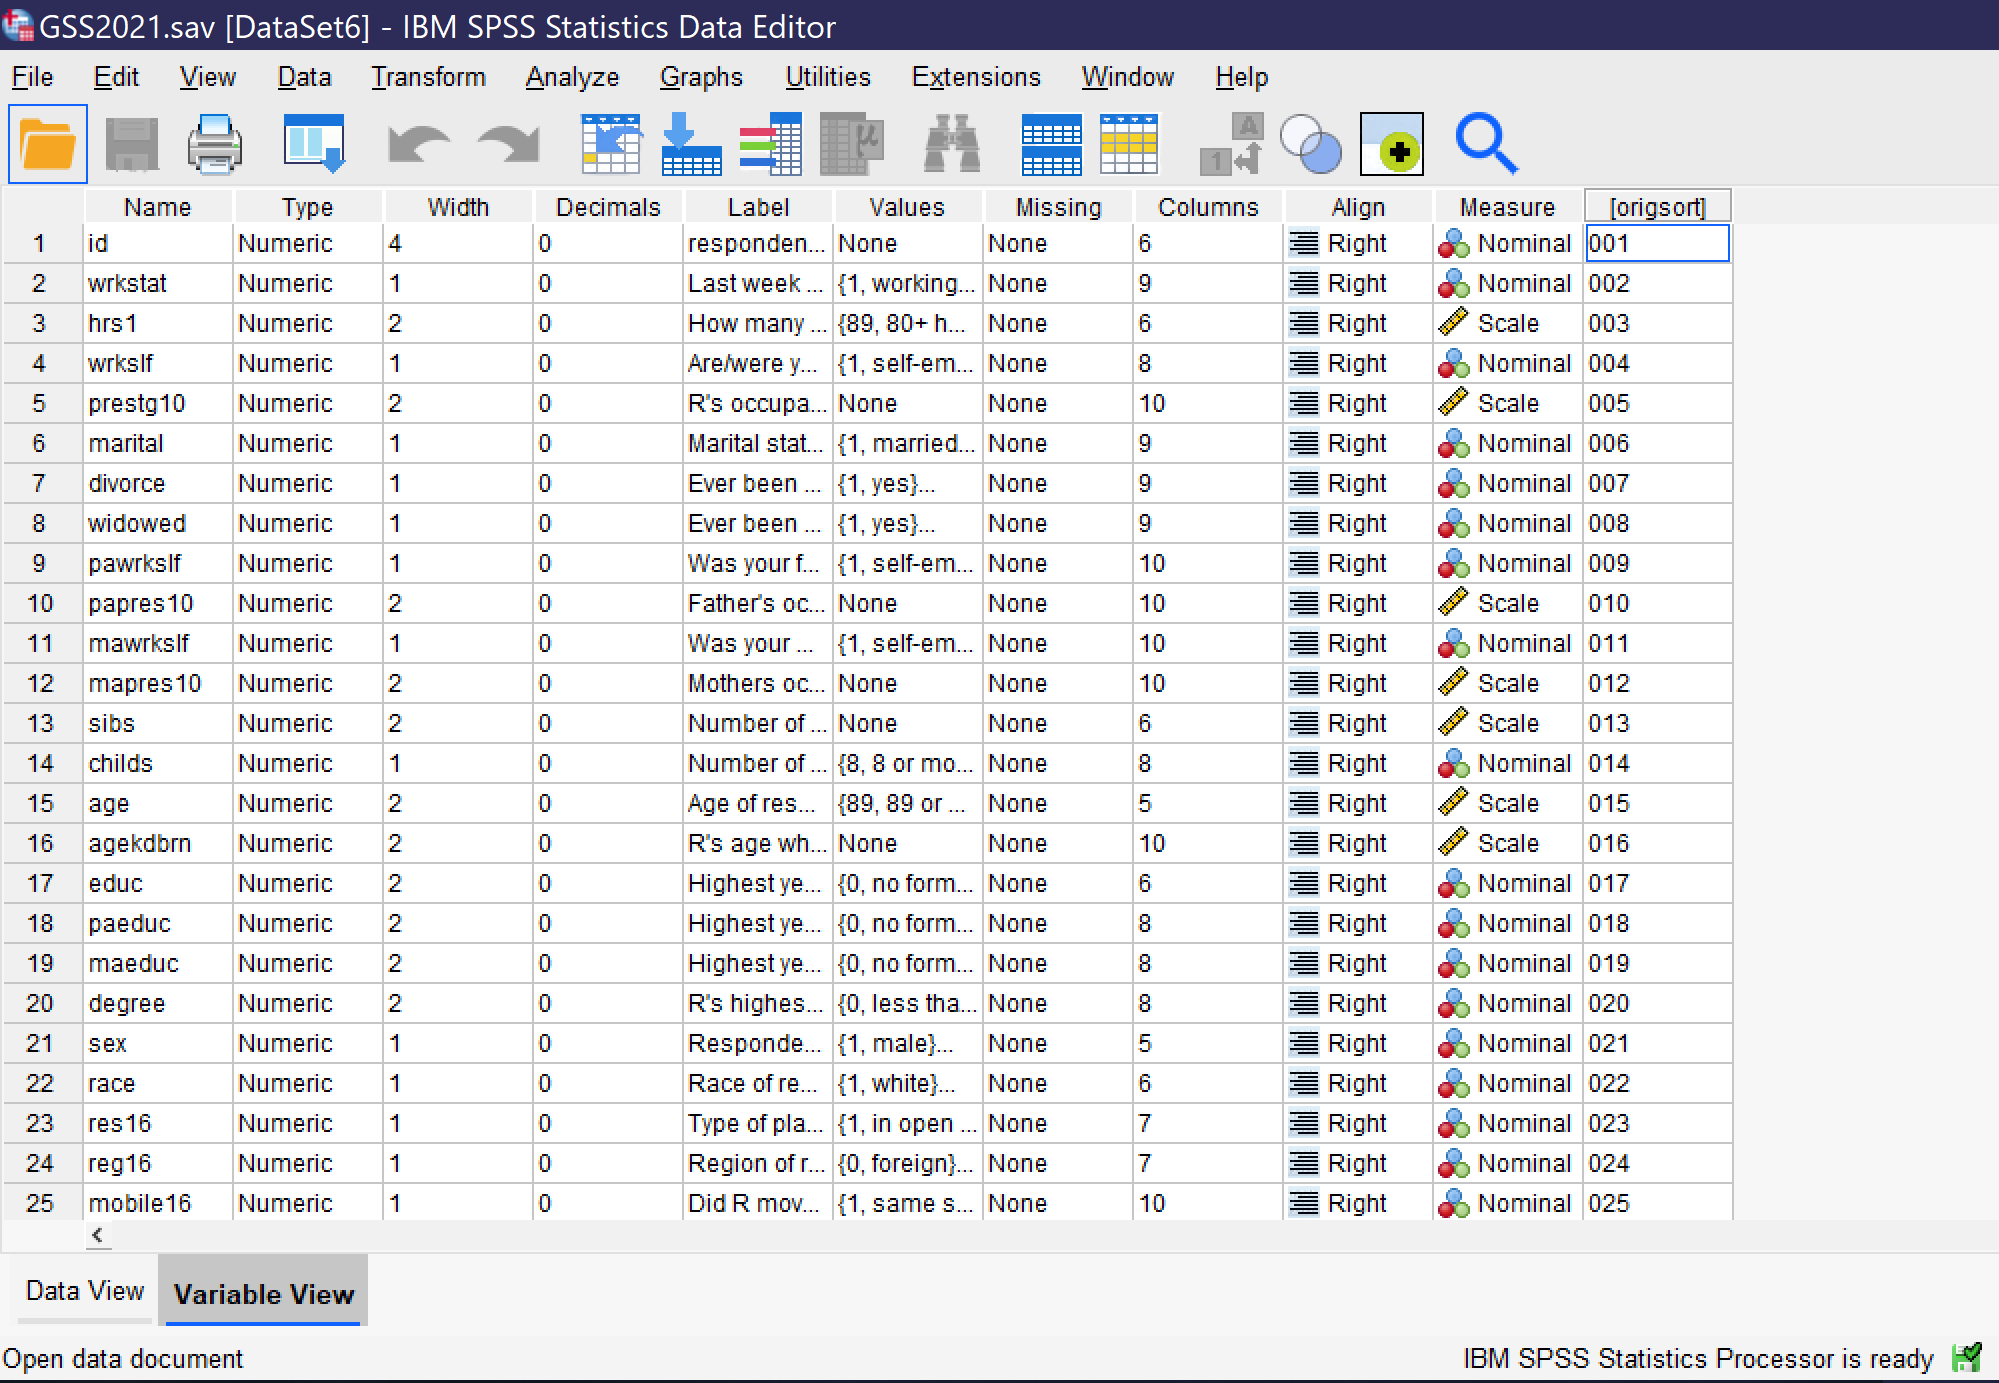
- Name requires that each variable be given a short name, without any spaces. There are additional rules about names, but in short, names should be primarily alphanumeric in nature and cannot be words or use symbols that have meaning for the underlying computer processing. Names can be entered directly.
- Type specifies the variable type. To open up the menu allowing the selection of variable types, click on the cell, then click on the three dots [.…] that appear on the right side of the cell. Users can then choose from among numeric, dollar, date, numeric with leading zeros, string, and other variable types.
- Width specifies the number of characters of width for the variable itself in data storage, while decimals specifies how many decimal places the variable will have. These can both be entered or edited directly or in the dialog box for Type.
- Label provides space for a longer variable name that spells out
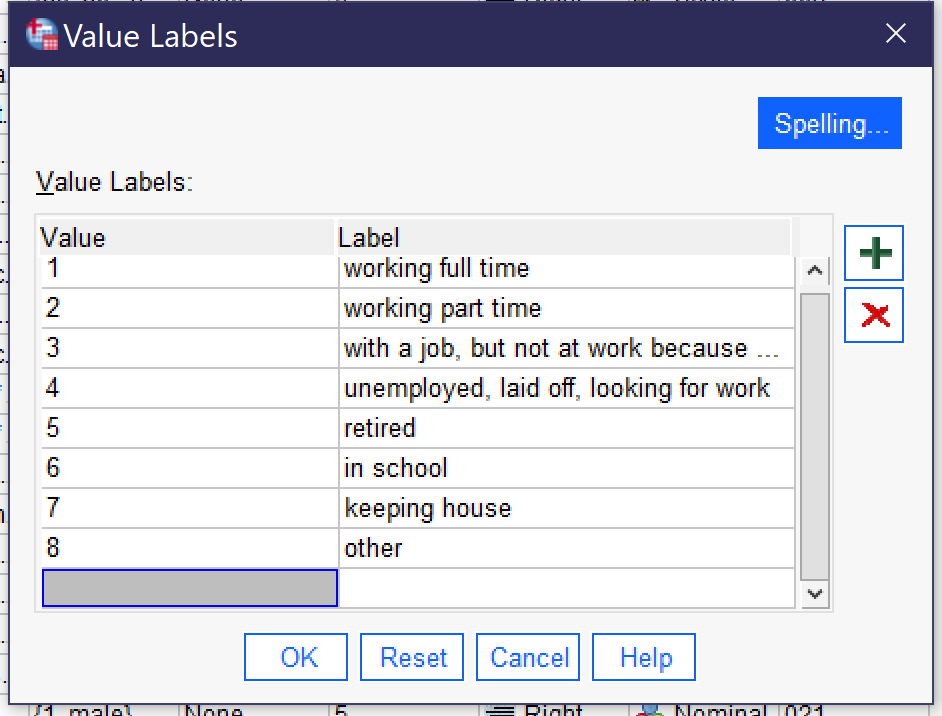
Figure 7. Value Labels Popup Window more completely what the variable is measuring. It can be entered directly.
- Values is where the attributes or value labels for a variable are specified. Clicking the three dots [.…]—remember, they are not visible until you click in a cell—opens a dialog box in which values and their labels can be entered, as shown in Figure 7. To enter a value and its label, click on the green plus sign. Then enter the numerical value under the “Value” column and the value label under the “Label” column, and continue doing this until all values are labled. Labels can be long, but the beginning portions should be easily distinguishable so analysts can work with them even when the entire label is not displayed. There is a “Spelling…” button for spell-checking your work. Use the red X to delete a value and its label.
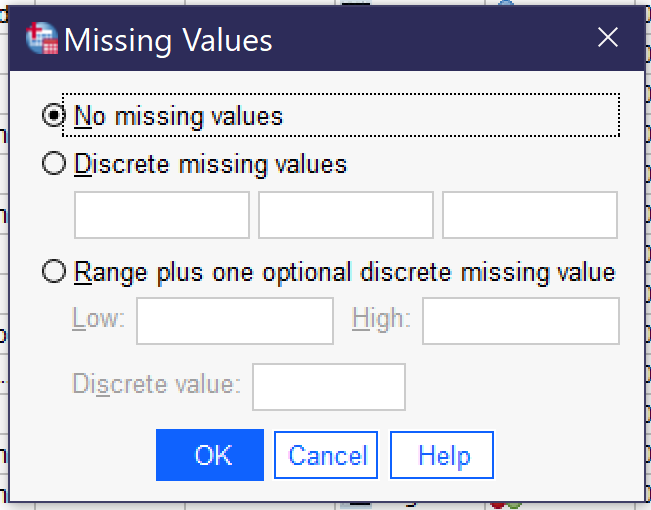
Figure 8. Missing Values Popup - Missing provides for the indication that particular values—like “refused to answer”—should be treated by the SPSS software as missing data rather than as analytically useful categories. Clicking the three dots [.…] opens a dialog box for specifying missing values. When there are no missing values, “no missing values” should be selected. Otherwise, users can select “discrete missing values” and then enter three specific missing values—the numerical values, not the value labels—or they can elect “range plus one optional discrete missing value” to specific a range from low to high of missing values, optionally adding an additional single discrete value.
- Columns specifies the width of the display column for the variable. It can be entered directly.
- Align specifies whether the variable data will be aligned right, center, or left. Users can click in the cell to make a menu appear or can press spacebar twice and then use arrows to select the desired alignment.
- Measure permits the indication of level of measurement from among nominal, ordinal, and scale variables. Users can click in the cell to make a menu appear or can press spacebar twice and then use arrows to select the desired level of measurement. Note that measure is often wrong in datasets and analysts should not rely on it in determining the level of measurement for selection of statistical tests; SPSS does not use this characteristic when running tests.
- Some datasets will have additional criteria. For example, the dataset shown in Figure 6 has a column called origsort which displays the original sort order of the dataset, so that if an analyst sorts the variables they can be returned to their original order.
When entering variable information, it is especially important to include Name, Label, and Values and be sure Type is correct and any Missing values are specified. Other variable information is less crucial, though clearly it is better to fully specify all variable information. Once all variable information is entered and double-checked and the dataset has been saved, it is ready for use.
Using SPSS
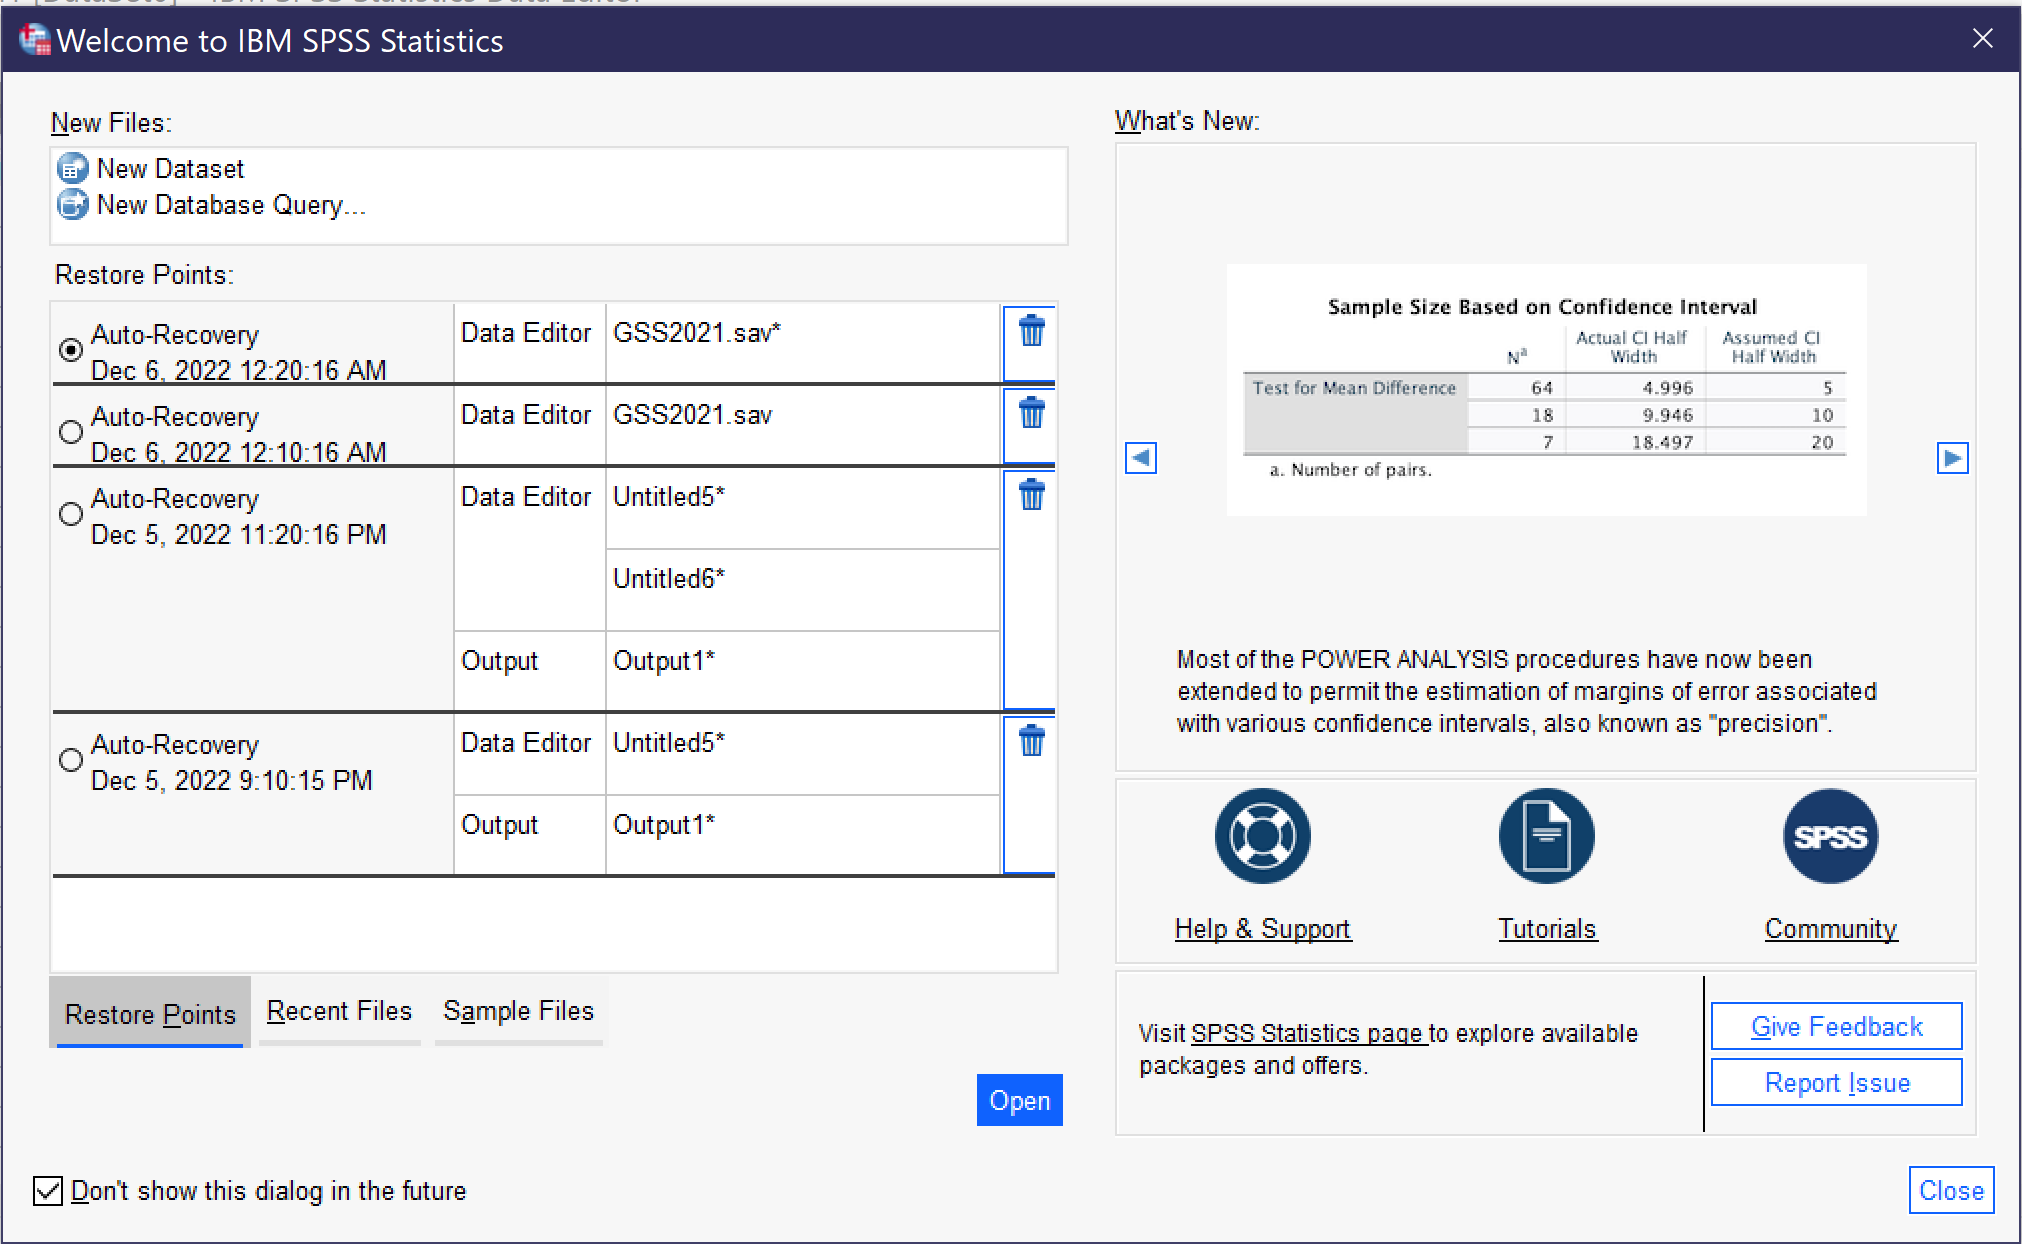
When a user first opens SPSS, they are greeted with the “Welcome Dialog” (see figure 9). This dialog provides tips, links to help resources, and options for creating a new file (by selecting “new dataset”) or opening recently used files. There is a checkbox for turning off the Welcome Dialog so that it will not be shown in the future.
When the Welcome Dialog is turned off, SPSS opens with a blank file. Going to File → Open → Data (Alt+F, O, D) brings up the dialog for opening a data file; the Open menu also provides for opening other types of files, which will be discussed below. Earlier in this chapter, the differences between Data View and Variable view were discussed; when you open a data file, be sure to observe which view you are using.
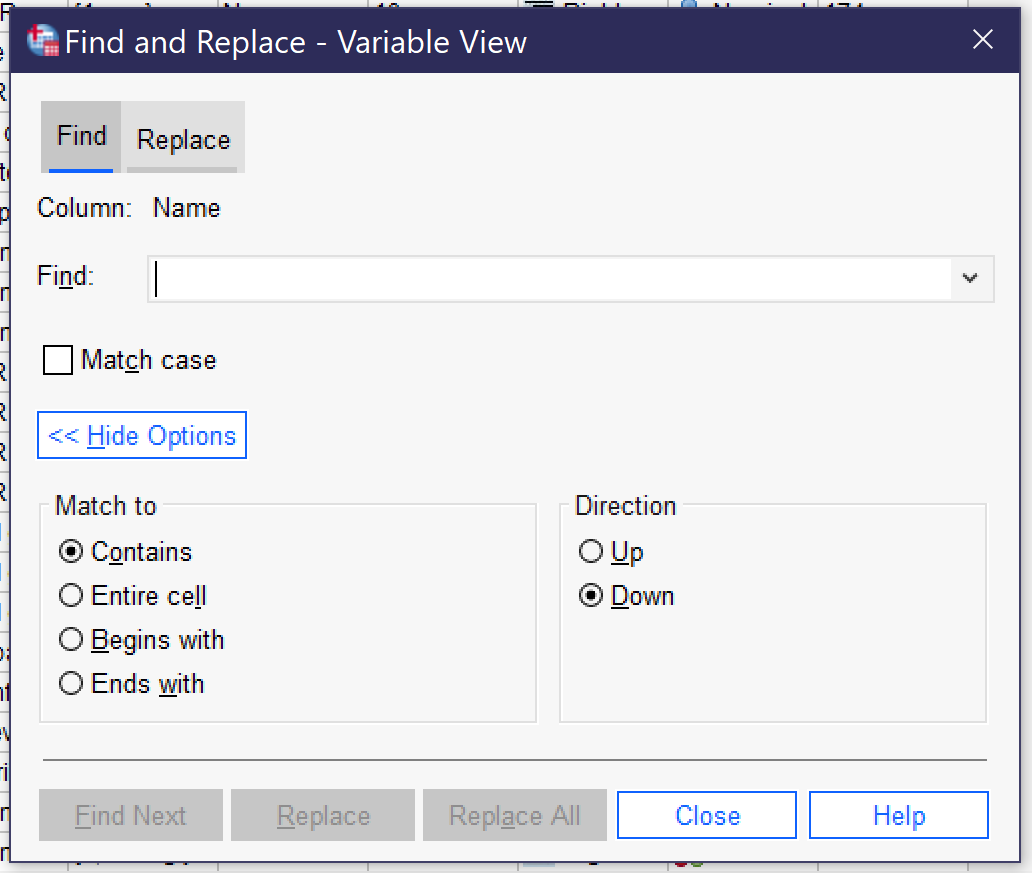
It can be useful to be able to search for a variable or case in the datafile. There are two main ways to do this, both under the Edit menu (Alt+E).[1] The Edit menu offers Find and Go To. Find, which can also be accessed by pressing Ctrl+F, allows users to search for all or part of a variable name. Figure 10 displays the Search dialog, with options shown after clicking on the “show options” button. (Users can also use the Replace function, but this carries the risk of writing over data and so should be avoided in almost all cases.) Be sure to select the column you wish to search—the Find function can only examine one column in Variable View at a time. Most typically, users will want to search variable names or labels. The checkbox for Match Case toggles whether or not case (in other words, capitalization) matters to the search. Expanding the options permits users to specify how much and which part of a cell must be matched as well as search order.
Users can also navigate to specific variables by using the Edit → Go to Case (to navigate to a specific case—or row in data view) and Edit → Go to Variable (to navigate to a specific variable—a row in variable view or a column in data view). Users can also access detailed variable information via the tool Utilities → Variables.
Another useful feature is the ability to sort variables and cases. Both types of sorting can be found in the data menu. Variables can be sorted by any of the characteristics in variable view; when sorting, the original sort order can be saved as a new characteristic. Cases can be sorted on any variable.
SPSS Options
The Options dialog can be reached by going to Edit → Options (or Alt+E, Alt+N). There are a wide variety of options available to help users customize their SPSS experience, a few of which are particularly important. First of all, using various dialogs and menus in the program is much easier if the options Variable List—Display Names (Alt+N) and Alphabetical (Alt+H) are selected under General. You can also change the display language for both the user interface and for output under Language, change fonts and colors for output under Viewer, set number options under Data; change currency options under Currency; set default output for graphs and charts under Charts; and set default file locations for saving files under File locations. While most of these options can be left on their default settings, it is really important for most users to set variables to display names and alphabetical before use. Options will be preserved if you use the same computer and user account, but if you are working on a public computer you should get in the habit of checking every time you start the program.
Getting More Out of SPSS
So far, we have been working only with Data View and Variable View in the main dataset window. But when researchers produce the results of an analysis, these results appear in a new window called Output—IBM SPSS Statistics Viewer. New Output windows can be opened from the File menu by going to Open → Output or from the Window menu by selecting “Go to Designated Viewer Window” (the later command also brings the output window to the foreground if one is already open). Output will be discussed in more detail when the results of different tests are discussed. For now, note that output can be saved in *.spv format, but this format can only be viewed in SPSS. To save output in a format viewable in other applications, go to File → Export, where you can choose a file location and a file format (like Word, PowerPoint, HTML, or PDF). Individual output items can also be copied and pasted.
SPSS also offers a Syntax viewer and editor, which can also be accessed from both the File and Window menus. While syntax is beyond the scope of this text, it provides the option for writing code (kind of like a computer program) to control SPSS rather than using menus and buttons in a graphical user interface. Experienced users, or those doing many similar repetitive tasks, often find working via syntax to be faster and more efficient, but the learning curve is quite steep. If you are interested in learning more about how to write syntax in SPSS, Help → Command Syntax Reference brings up a very long document detailing the commands available.
Finally, the Help menu in SPSS offers a variety of options for getting help in using the program, including links to web resource guides, PDF documentation, and help forums. These tools can also be reached directly via the SPSS website. In addition, many dialog boxes contain a “Help” button that takes users to webpages with more detail on the tool in question.
Exercises
Go to https://www.baseball-reference.com/ and select 10 baseball players of your choice. In an Excel or other spreadsheet, enter the name, position, batting arm, throwing arm, weight in pounds, and height in inches, as well as, from the Summary: Career section, HR (home runs) and WAR (wins above replacement). Each player should get one row of the Excel spreadsheet. Once you have entered the data, import it into SPSS. Then use Variable View to enter the relevant information about each variable—including value labels for position, batting arm, and throwing arm. Sort your cases by home runs. Finally, save your file.
Media Attributions
- import menu
- import excel © IBM SPSS is licensed under a All Rights Reserved license
- import csv © IBM SPSS is licensed under a All Rights Reserved license
- output window © IBM SPSS is licensed under a All Rights Reserved license
- spss data view © IBM SPSS is licensed under a All Rights Reserved license
- variable-view © IBM SPSS is licensed under a All Rights Reserved license
- value labels © IBM SPSS is licensed under a All Rights Reserved license
- missing values © IBM SPSS is licensed under a All Rights Reserved license
- welcome dialog © IBSM SPSS is licensed under a All Rights Reserved license
- find and replace © IBM SPSS is licensed under a All Rights Reserved license
- Note that "Search," another option under the Edit menu, does not search variables or cases but instead launches a search of SPSS web resources and help files. ↵
A data type that represents non-numerical data; string values can include any sequence of letters, numbers, and spaces.
The possible levels or response choices of a given variable.
